Phase 1. Discover: Achieve Architecture Transparency
Establish architecture transparency in ERP transformation. Understand and assess your 'as-is architecture' and report effectively.
Overview
Architecture transparency entails a comprehensive understanding of your IT landscape, business processes, and data flows, along with their dependencies and risks. This involves evaluating existing capabilities, applications, and interfaces to identify strengths, weaknesses, and areas for improvement. The as-is assessment provides valuable insights for data-driven decision-making and establishes a data foundation that guides the direction your organization wants to take with the ERP transformation.
Note
The approach described here is rather suitable for a new ERP implementation (Greenfield). If you plan a system conversion (Brownfield), your focus will be mostly on applications and interfaces. For a hybrid approach, you “play” between bottom-up and top-down scoping strategies.
In the Discovery phase, do the following:
- Model LeanIX Fact Sheets and build your repository.
- Scope ERP transformation: Define the scope of your ERP transformation in close alignment with the business.
- Report and communicate: Establish a clear format for sharing results with diverse stakeholders and share various perspectives for a transparent view of the 'as-is' architecture.
The following overview provides a “Definition of Done” with Milestones that you should achieve in this phase, and EA-relevant Reports and KPIs suggested by LeanIX that are explained in detail in a separate section Report and Communicate in each phase of the ERP Transformation.
| Milestones | KPIs/Reports |
Identify your organization’s Objectives and the strategic relevance and maturity of the Business Capabilities supporting those Objectives. Understand which Business Capabilities are in scope of the ERP transformation. |
 |
| Understand which Application, Organization, and Interface Fact Sheets are affected by the Business Capabilities in scope. | 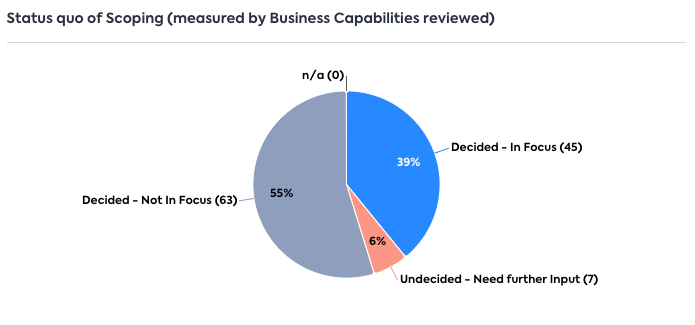 |
| Defined mandatory attributes (based on best practices from LeanIX: e.g., lifecycle, Technical and Functional Fit, Business Criticality). | 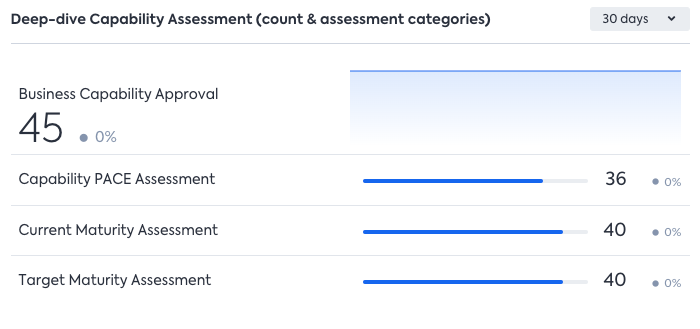 |
Step 1. Model LeanIX Fact Sheets and Build Your Repository
How much pre-work needs to be done to start your transformation use case depends on your overall LeanIX adoption. If your organization has been using LeanIX already for some time, you might have a more or less complete inventory and view of your as-is architecture. If you are starting to use LeanIX for your ERP transformation, you need to build that repository from scratch. This step is actually a classical Application Portfolio Assessment with LeanIX, where we add some additional sub-steps (outlined below). Make sure to apply the best practices explained in the Application Portfolio Assessment use case guide, which gives you a detailed overview of how to build your foundation in LeanIX, add key Fact Sheets, get data, e.g., via Surveys, and do your first assessment.
In this step, you should model the following Fact Sheet types in LeanIX.
Use Surveys and Quality Seal for High Data Quality
A big undergoing like an ERP Transformation requires 100% reliability on data. Make use of LeanIX Surveys to verify and gather data that is relevant to you, and use a Quality Seal to ensure that you have all the information needed. Also, make sure that all Fact Sheets have clear ownership.
- Add Application Data to LeanIX: It involves adding information about Applications and their relevant attributes, such as relations/dependencies, lifecycles, Technical Fit, Functional Fit, Business Criticality, Organization (e.g., User Groups), and IT Components into the platform. This can be done via the Excel Import/Export function, manual creation of Fact Sheets, or crowdsourcing via Surveys. Key mandatory attributes are:
- Lifecycle
- Business criticality (to ensure operational stability)
- Functional / Technical Fit (to challenging status-quo / complexity reduction)
- Add Business Capabilities and link them to Applications to show how your Applications support your organization's high-level activities and to scope your ERP transformation use case. Defining Business Capability properties such as responsible owner and Applications used can provide a better understanding of each capability's impact. Ensure your Business Capabilities are well-defined and communicated throughout the organization. Key mandatory attributes are:
- Maturity (to understand how well they are supporting your Objectives to day vs. what the target maturity is)
- Relations with Applications, Business Context (Processes) if applicable (see below), Objectives (can be linked once Objective Fact Sheet is created)
- Gartner Pace Layering (can be applied using the Strategic Importance field in Business Capability Fact Sheets). To learn more, see Pace Layering
- Add Objectives that come from your business and link them to Business Capabilities and Organizations. Having Objectives will ensure that anything you plan in LeanIX is aligned to/ supports the strategic goals of your organization. It will help you decide which Business Capabilities should be in scope for your transformation, and - vice versa - how the Business Capabilities in scope of your transformation will improve your organization’s objectives.
Both Business Capabilities and Objectives drive strategic thinking in your organization! - Add Organization to get an understanding of the user base of your Applications and as a baseline for a phase-based ERP rollout.
- Add Interfaces to get transparency of dependencies between different Applications and assess your current and future integration architecture. Add the following attributes:
- Description
- Data flow direction
- Providing Application
- Consuming Application
- Frequency
- Interface type
- Relation with Data Objects
- If applicable: Relations with IT Components to understand technical dependencies
- Add Business Context (e.g., Processes) if your organization is process-driven. This will help you to gain a deep understanding of your business processes, align them with the IT landscape, trace impacts, improve processes through the transformation, make informed decisions, and foster collaboration among stakeholders. If your organization is using SAP Signavio, you can leverage the LeanIX-SAP Signavio out-of-the-box integration to automate the process and synchronize information in both tools.
Overview of Fact Sheet types and relations that need to be modeled in this step:
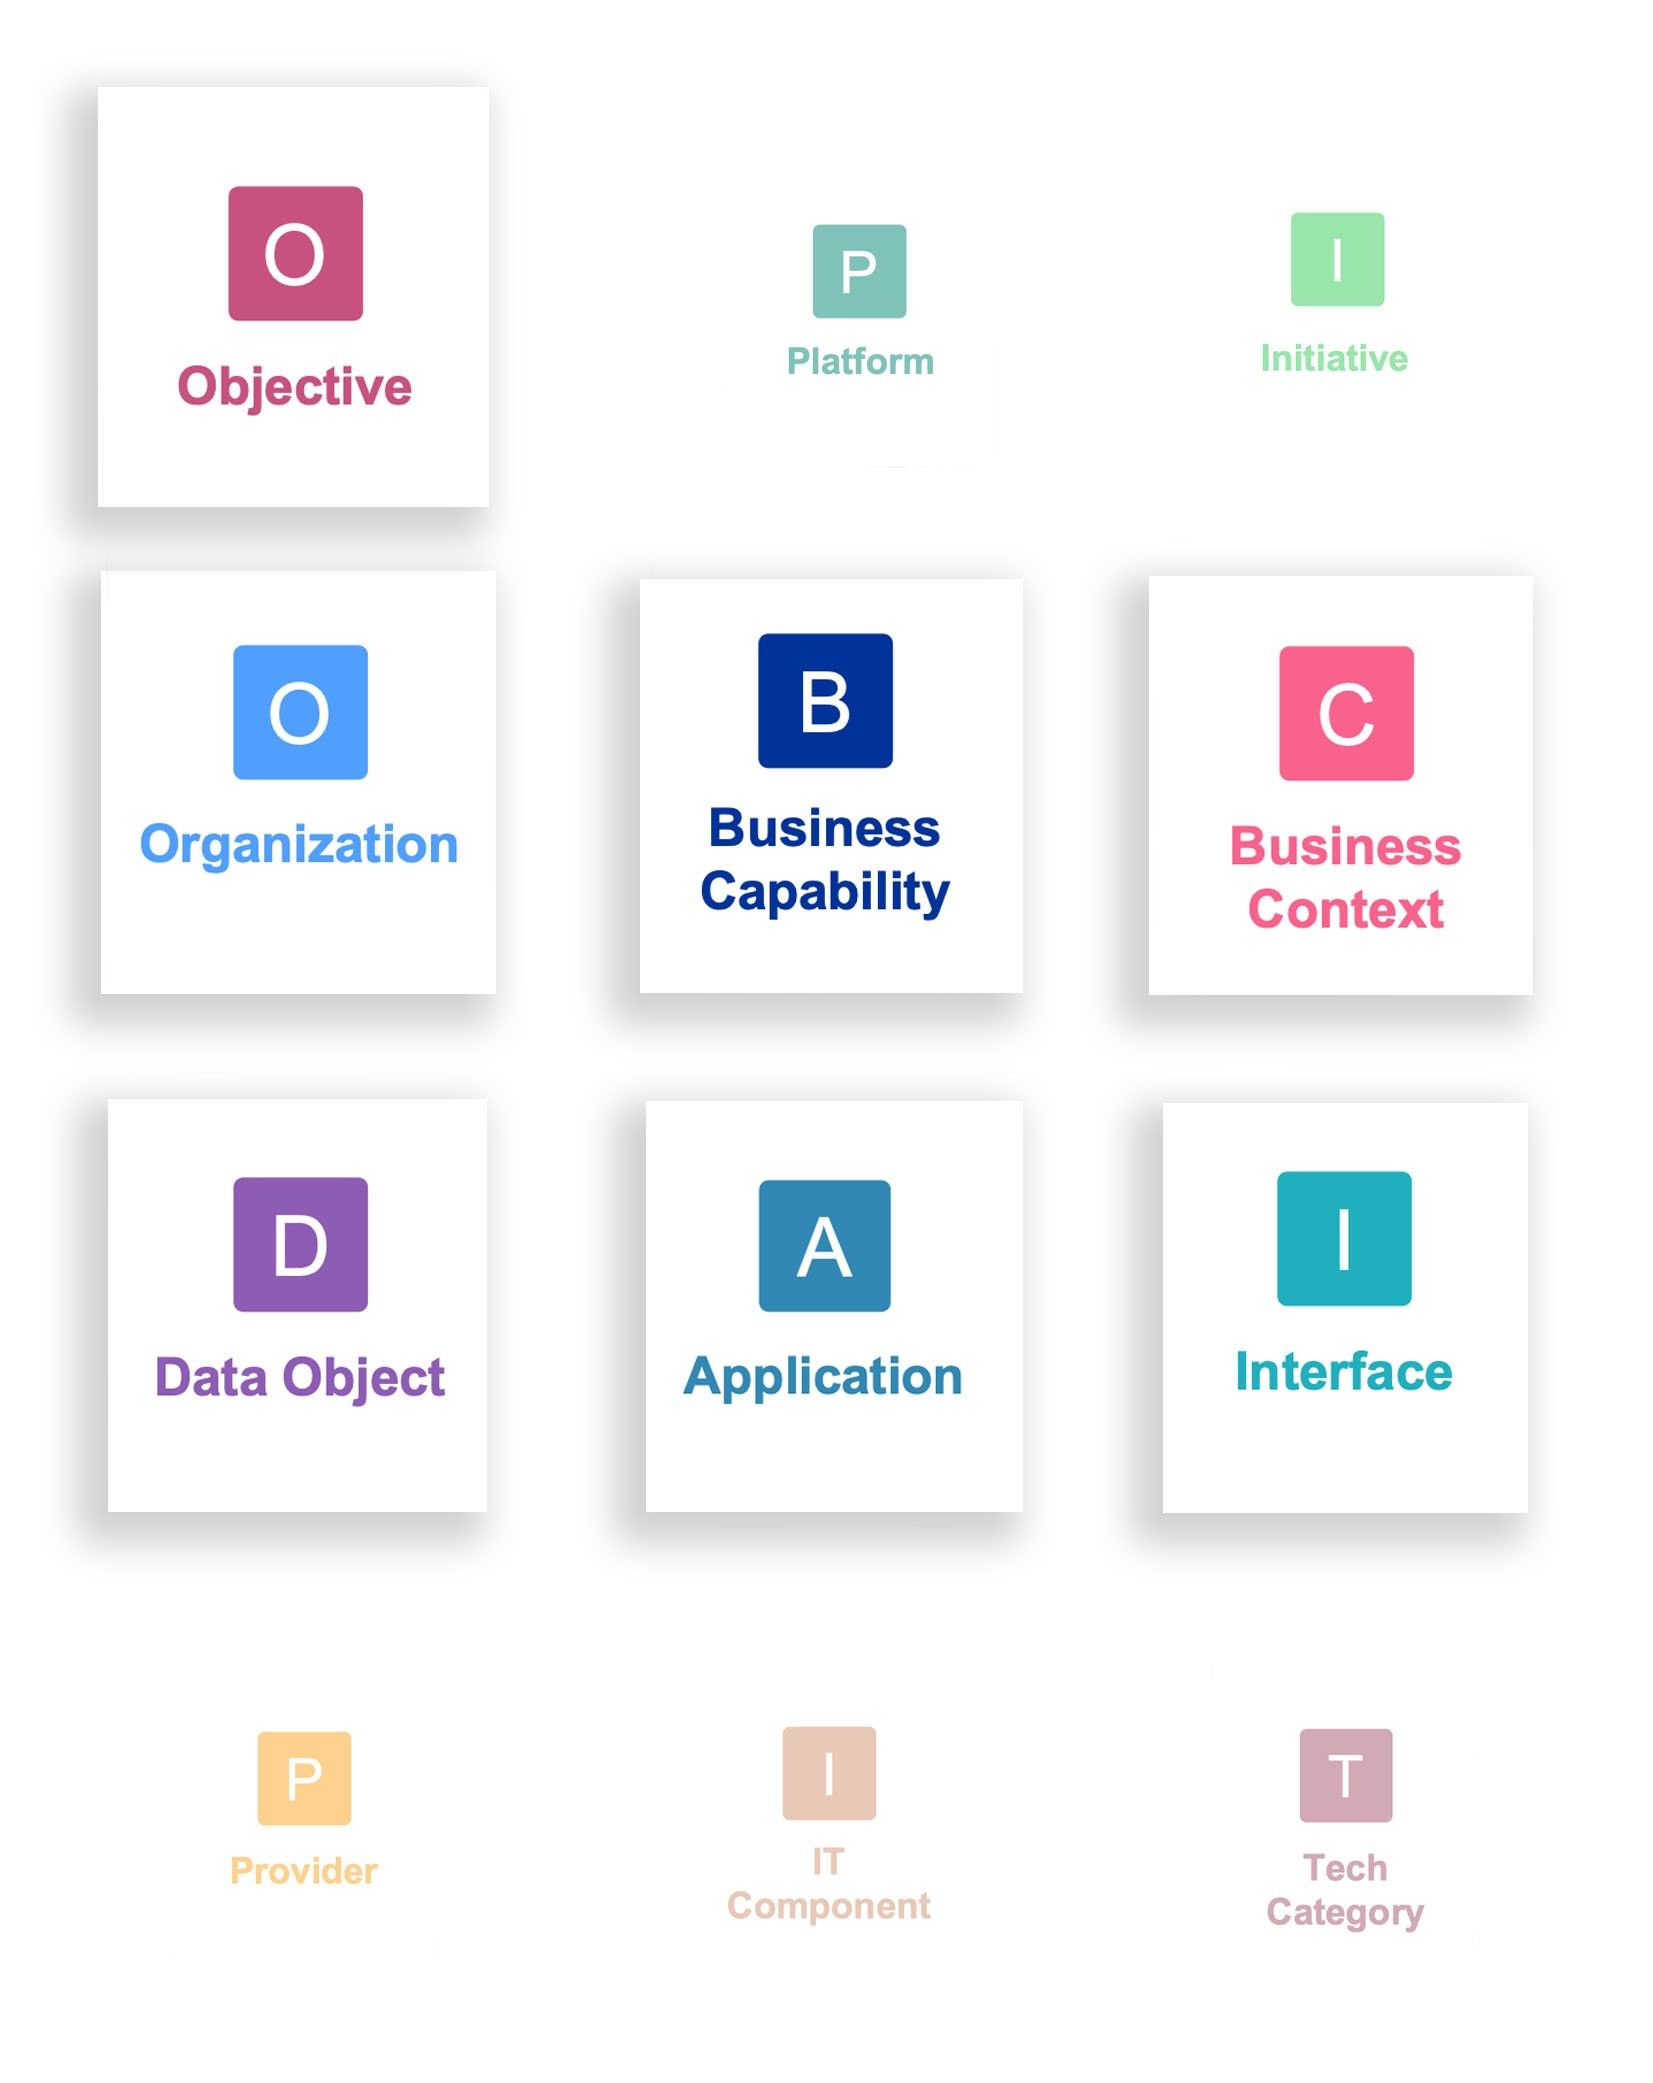
Fact Sheet types relevant for the Discovery phase of ERP Transformation
Step 2. Scope ERP Transformation
In this step, you will define the scope of your ERP transformation in close alignment with the business. For this, you will start with the business architecture layer in LeanIX to ensure that all your decisions are business-driven and support your organization’s strategy. This helps you to get a first view of your target architecture and plan your transformation in the next steps.
In this step, you will:
- Define what Business Capabilities (mapped to your Objectives) are impacted by the ERP transformation.
- Explore how the rest of your Inventory is affected by the transformation, for example, what Applications or Organizations are related to the Business Capabilities in scope, and which Interfaces need to be considered.
Refer to the Reports documentation in LeanIX for detailed information on helpful reports. Additionally, refer to the Application Portfolio Assessment and Application Modernization use case guides for insights on building these reports and to make the most out of it.
The scoping activity should happen in close alignment with your business, with clear ownership of the Business Capabilities by business owners who understand what Business Capabilities mean. As an EA leading this effort, you would facilitate those discussions, e.g., as part of scoping workshops.
The LeanIX best-practice approach for scoping consists of the following three steps:
- Leverage Gartner’s Pace Layering methodology to understand the strategic relevance of your Business Capabilities and derive decisions to build your target architecture. The three Pacer Layers (commodity, innovation, differentiation) facilitate conversations around the following questions:
- Commodity: Where in my application landscape do I want to leverage standards? For example, if you are driving an SAP transformation, this is where you would leverage standard capabilities from the SAP reference architecture.
- Innovation: Where do I want to be innovative and build custom applications?
- Differentiation: Which areas are relevant for my business and differentiate us from our competitors?
- Define a tag group called “ERP Transformation scope” with four values: Pain Point, In scope, Opportunity, To be decided (later), Out of Scope (non-ERP-related), and strong support already. For information on tags, refer Tagging.
- Have conversations with the business, and assign tags to your Business Capabilities. You can leverage the table view to drive informed decision-making in your discussions and document the results. As an outcome, all Business Capabilities should have a tag.
Use Reports and Diagrams to Visualize the Transformation Scope
One of the first outcomes of the data gathering and scoping will be a validated Business Capability Map and a view of capabilities in scope.
-
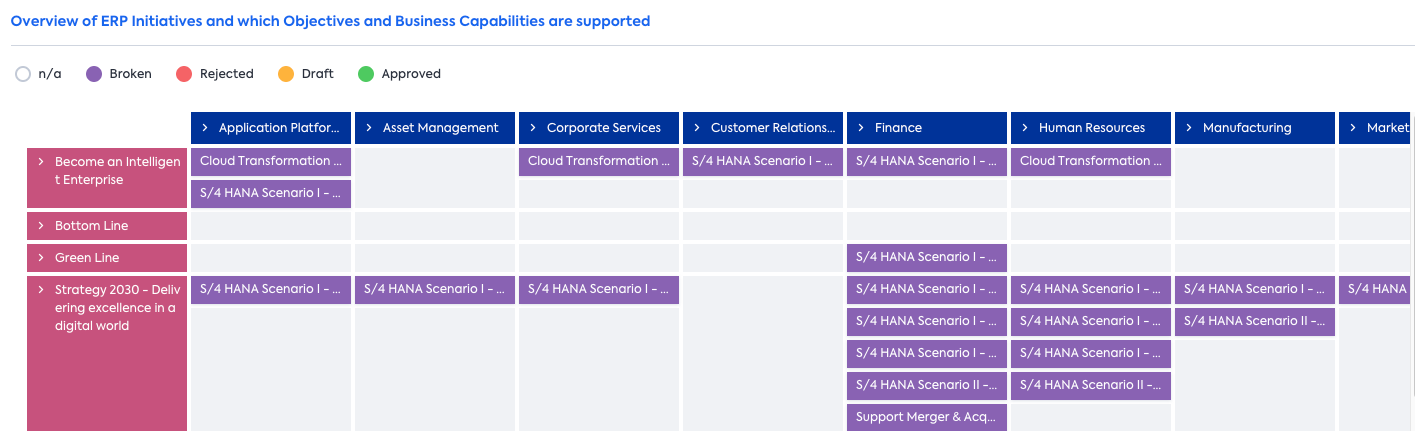
Create a Landscape Report with Business Capabilities mapped to Objectives that shows how your in-scope capabilities will improve to support your strategic Objectives driving the transformation. This view reflects the business architecture target state - the aspiration of where your organization is heading with this transformation on a business level. The color coding of the Business Capabilities reflects the three Pace Layers Commodity, Differentiation, Innovation (as per selected Report View “Strategic Importance”):
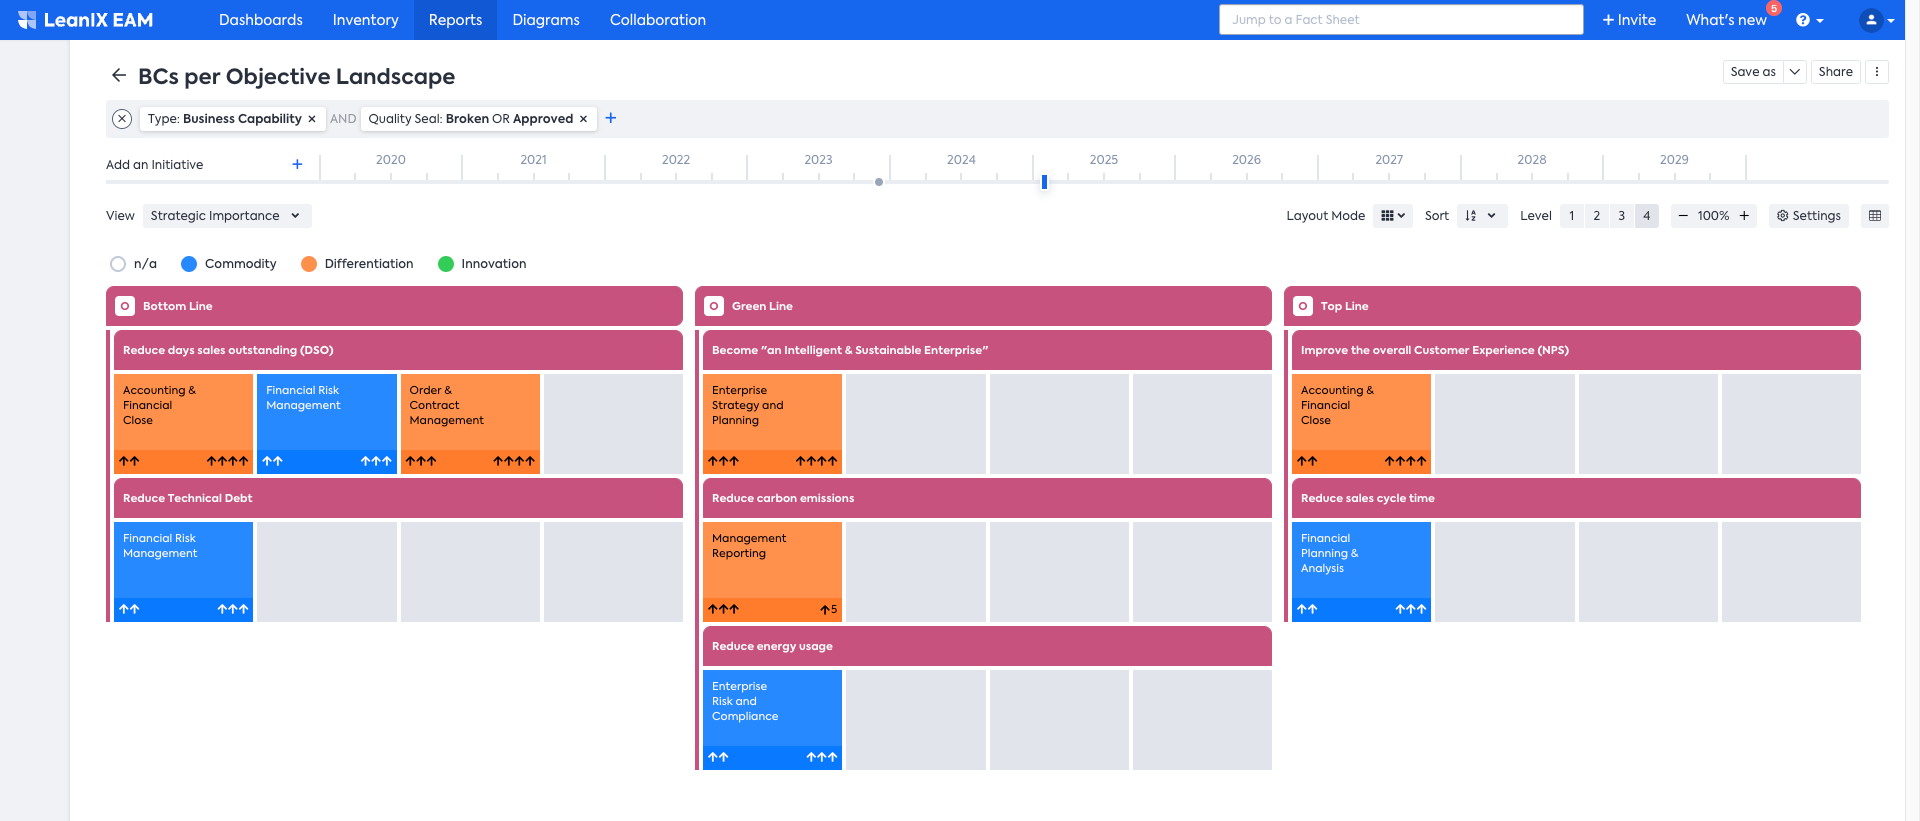
Landscape Report with Business Capabilities mapped to Objectives
-
Create an Application Landscape Report that shows which active Applications are affected by the transformation (achieved through a clustering by Business Capabilities in scope) and what their current status of Functional Fit (stars on the left-hand side) and Technical Fit (stars on the right-hand side) are. To learn more about Landscape Report, check Landscape Report.
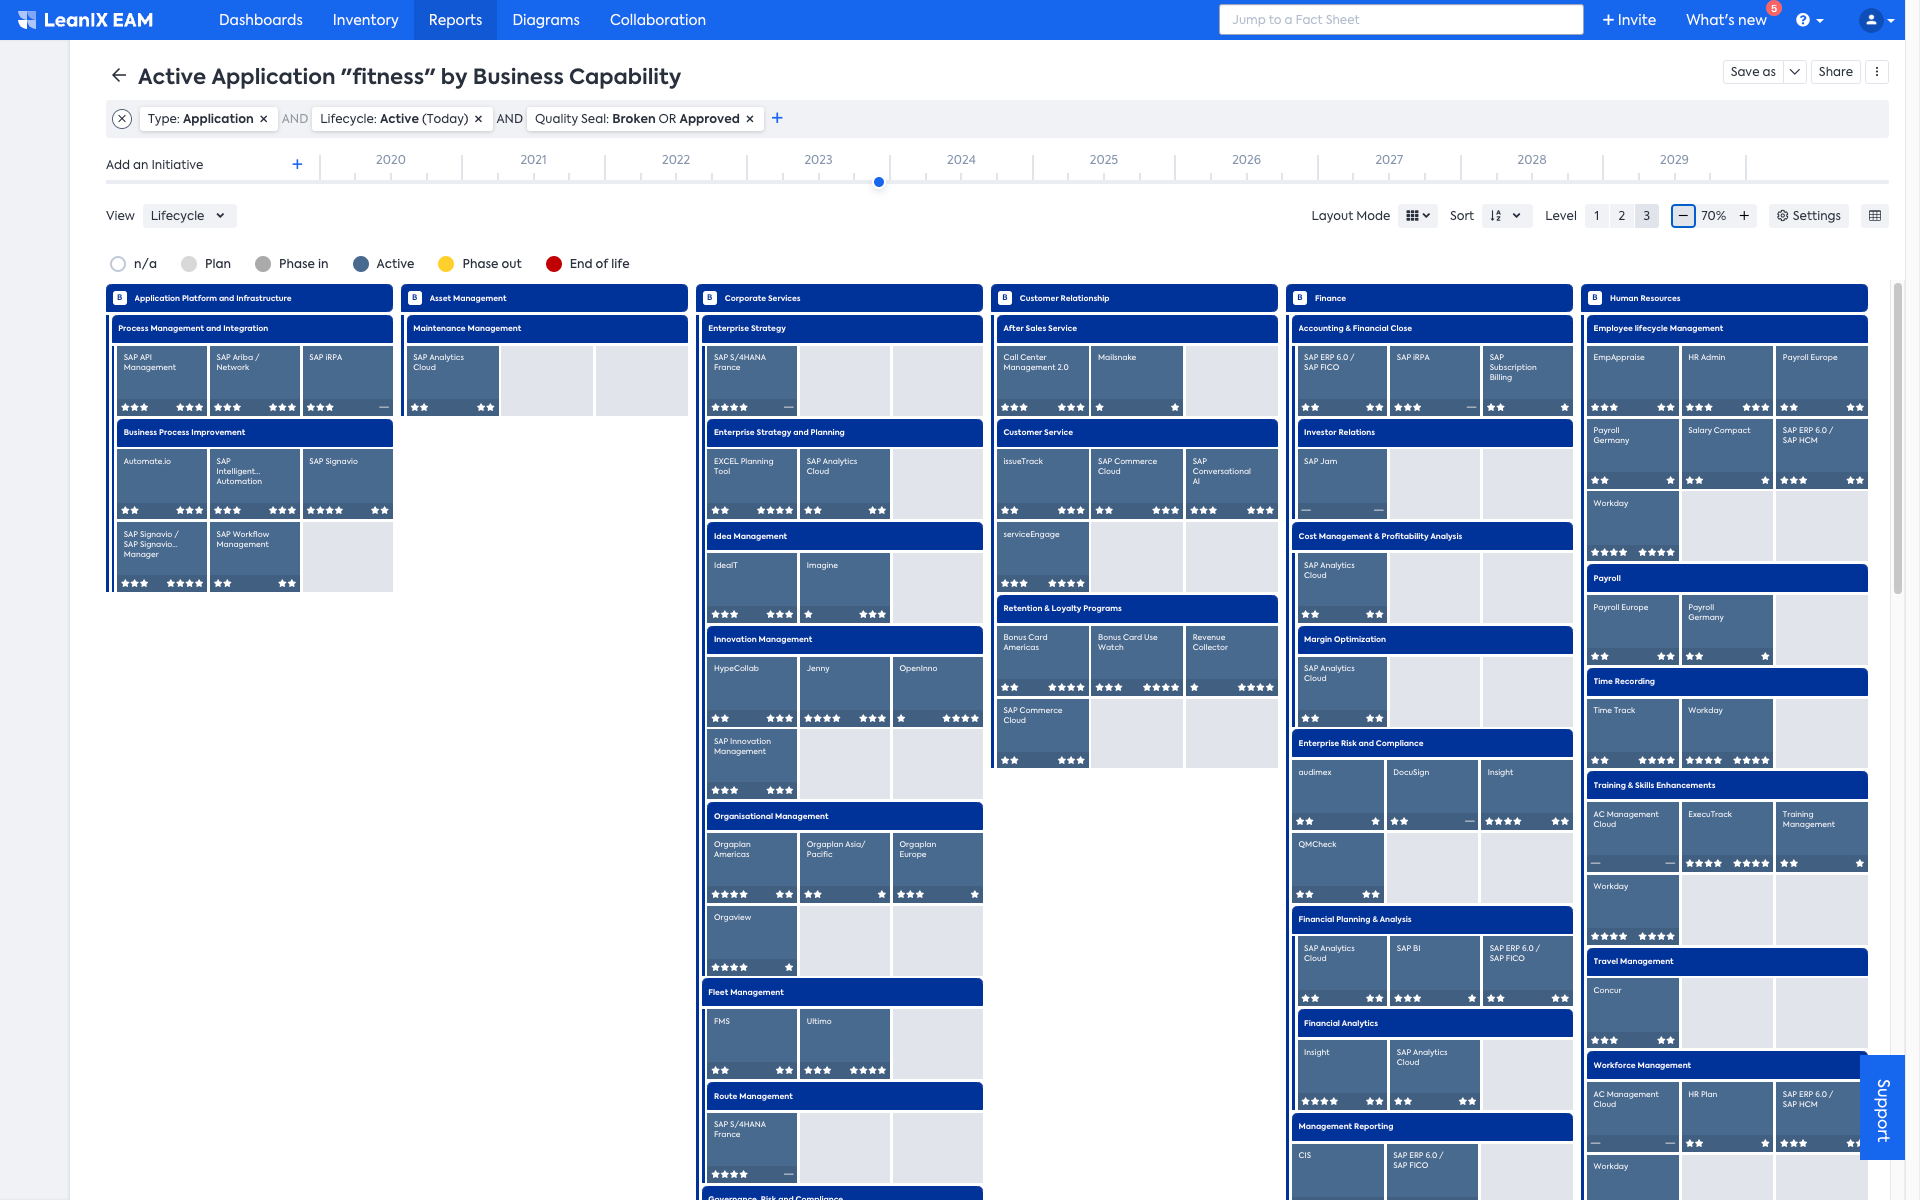
Active Applications with Functional and Technical Fit
-
Create a Matrix Report showing which Applications are affected in which parts of your Organizations (e.g., Regions and/or Business Units) by the ERP transformation (clustered by the Business Applications in the scope of the transformation). To learn more on Matrix report, see Matrix Report.
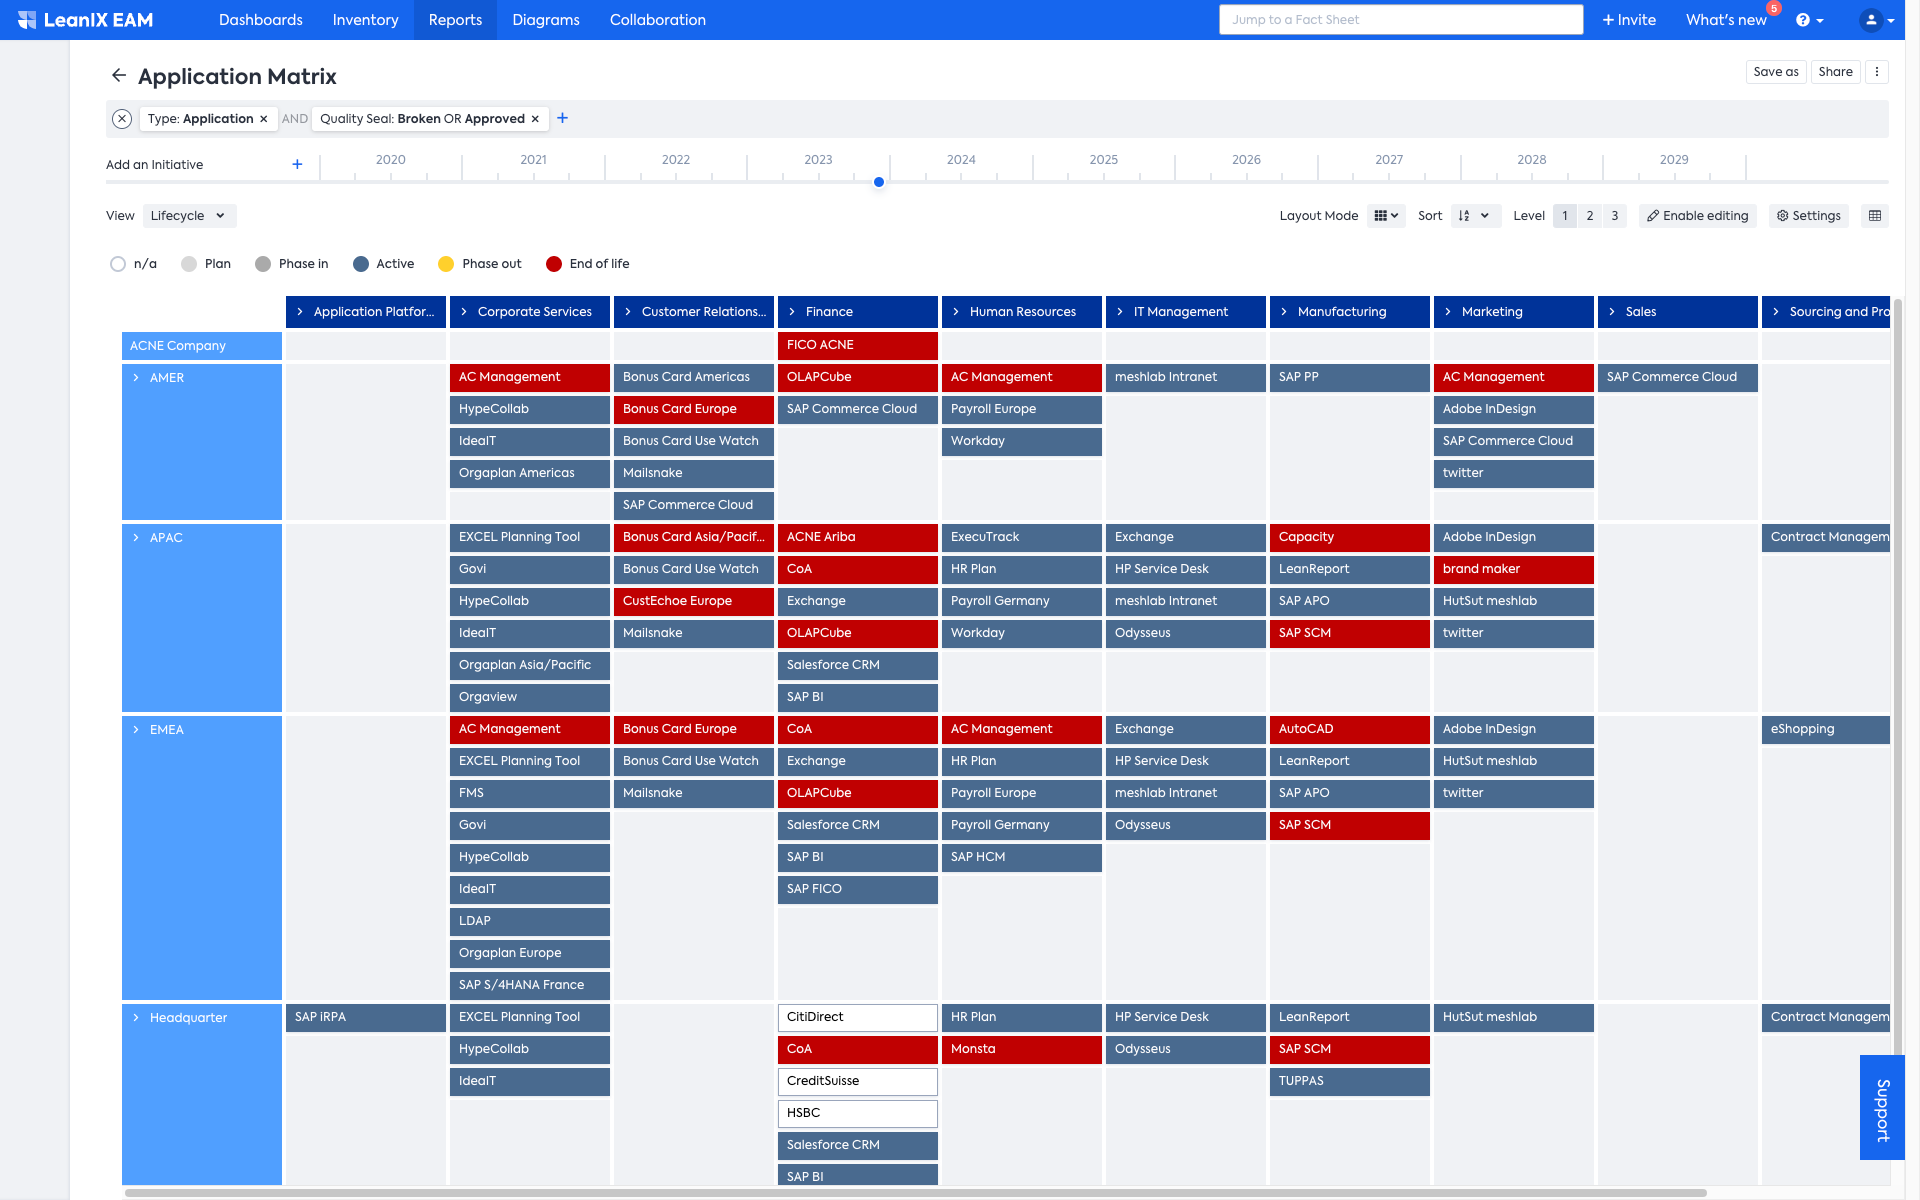
Matrix Reports showing Applications affected in different Organizations
In the next step, you want to understand all your interfaces, e.g., by sending a survey to all Application Owners to review all their Applications and verify existing or missing interfaces (and technical details related to those). You can use a quality seal to ensure that you have all the information needed (e.g., technical dependency).
If you are doing an SAP transformation, you can leverage Bill of Materials
-
Create an Interface Circle Map showing dependencies between different ERP solutions, and understand your integration architecture. You can read more about Interface Circle Map here. You can use it as a starting point to explore data flows.
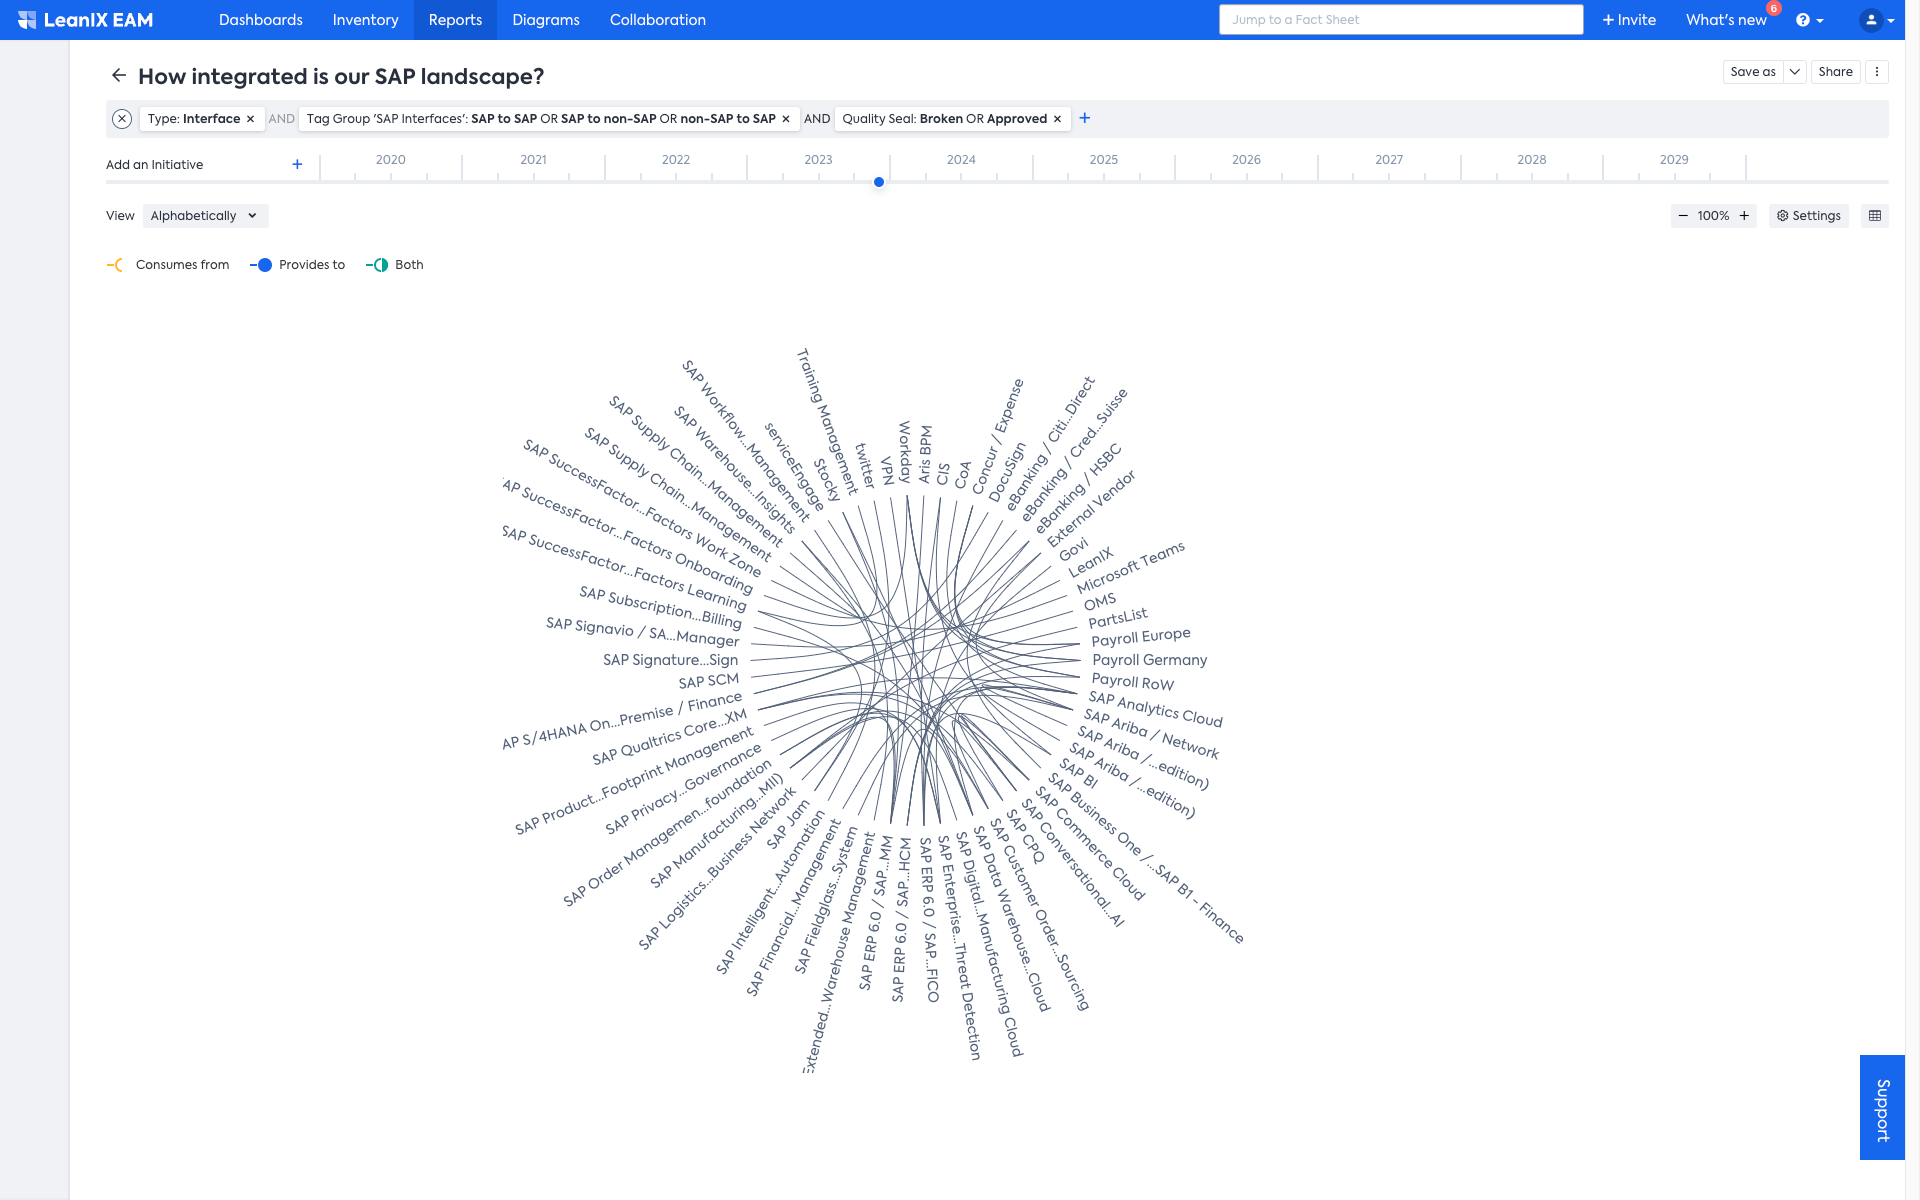
Interface Circle Map
-
Leverage the Data Flow Diagram for a closer look at Interfaces: At this step, typically, an Integration Architect would dig deeper and work with Application Owners and Solution Architects to verify/capture technical dependencies. This will inform your overall planning of the program. For information on the Data Flow Diagram, check Data Flow Diagram.
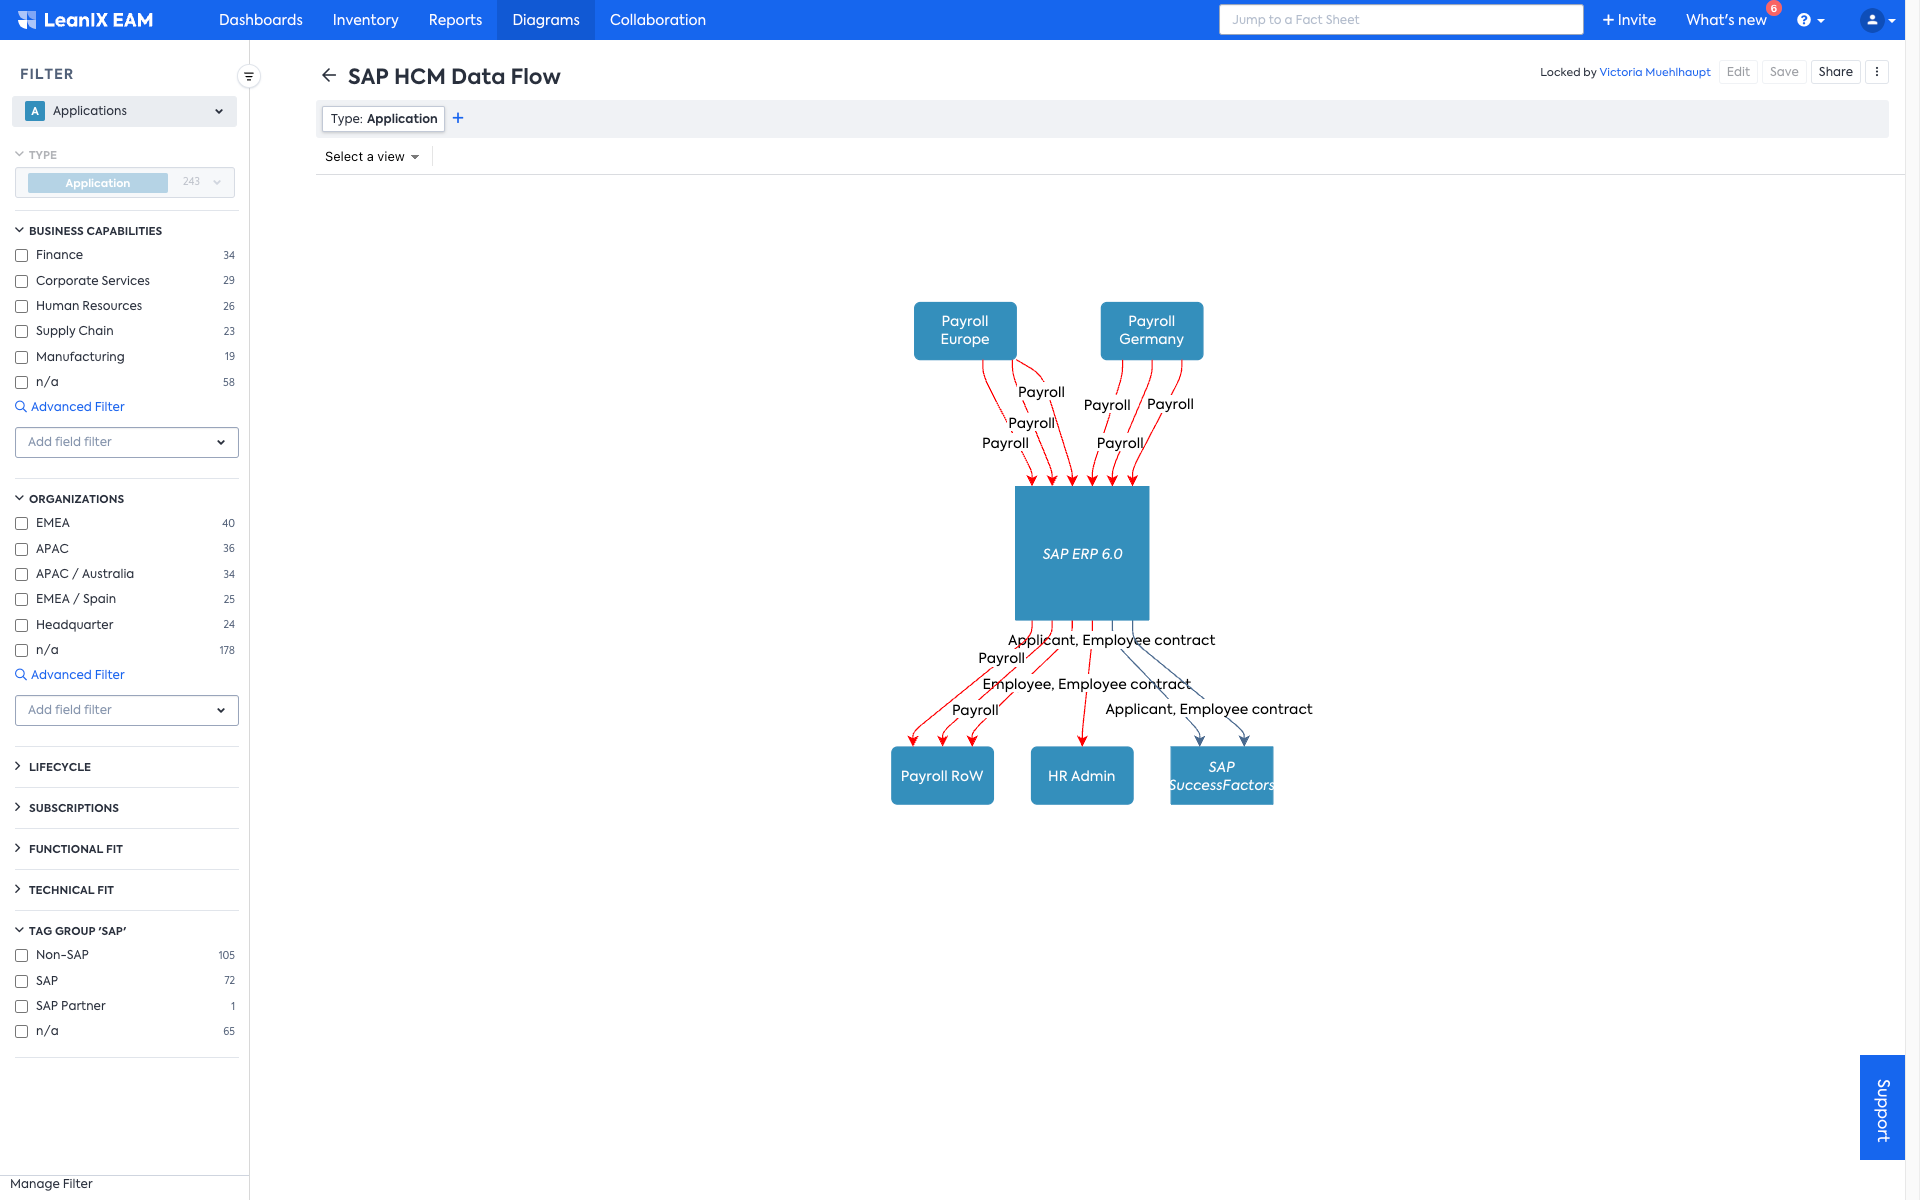
Data Flow Diagram To Have a Closer Look at Interfaces
If Applicable: Additional Features and Views Leveraging SAP Reference Data
LeanIX is part of the SAP ecosystem and provides the option for SAP customers to leverage SAP reference data helping you accelerate the journey. Below, you can see some illustrative report views that you can create based on that reference data to display your current vs. target business architecture.
Example report view: Start with SAP Reference Architecture or compare to current Business Capabilities.
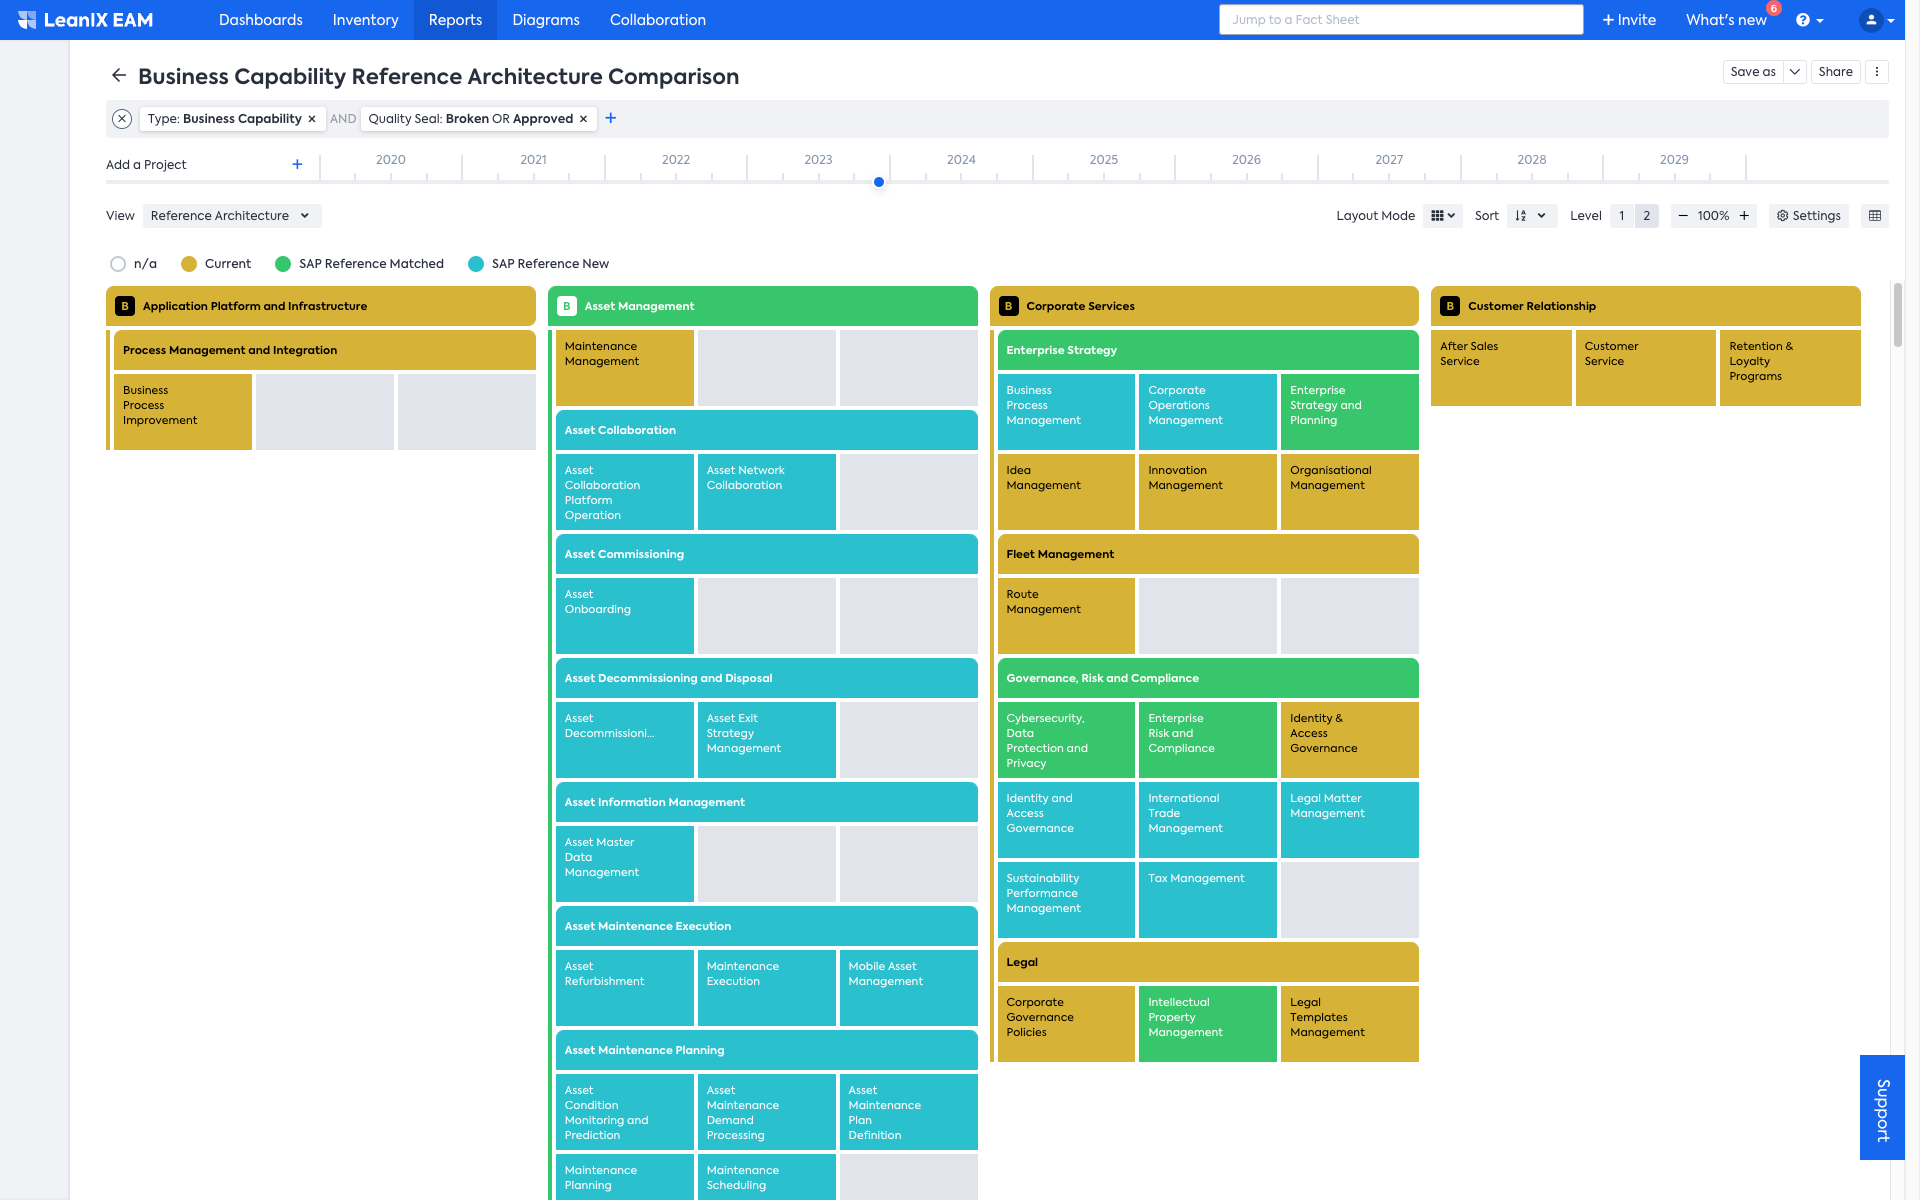
Business Capability Reference Architecture Comparison
Example report view: Understand how Business Capabilities can be supported by current Applications and by Recommendations from the SAP Reference Architecture:
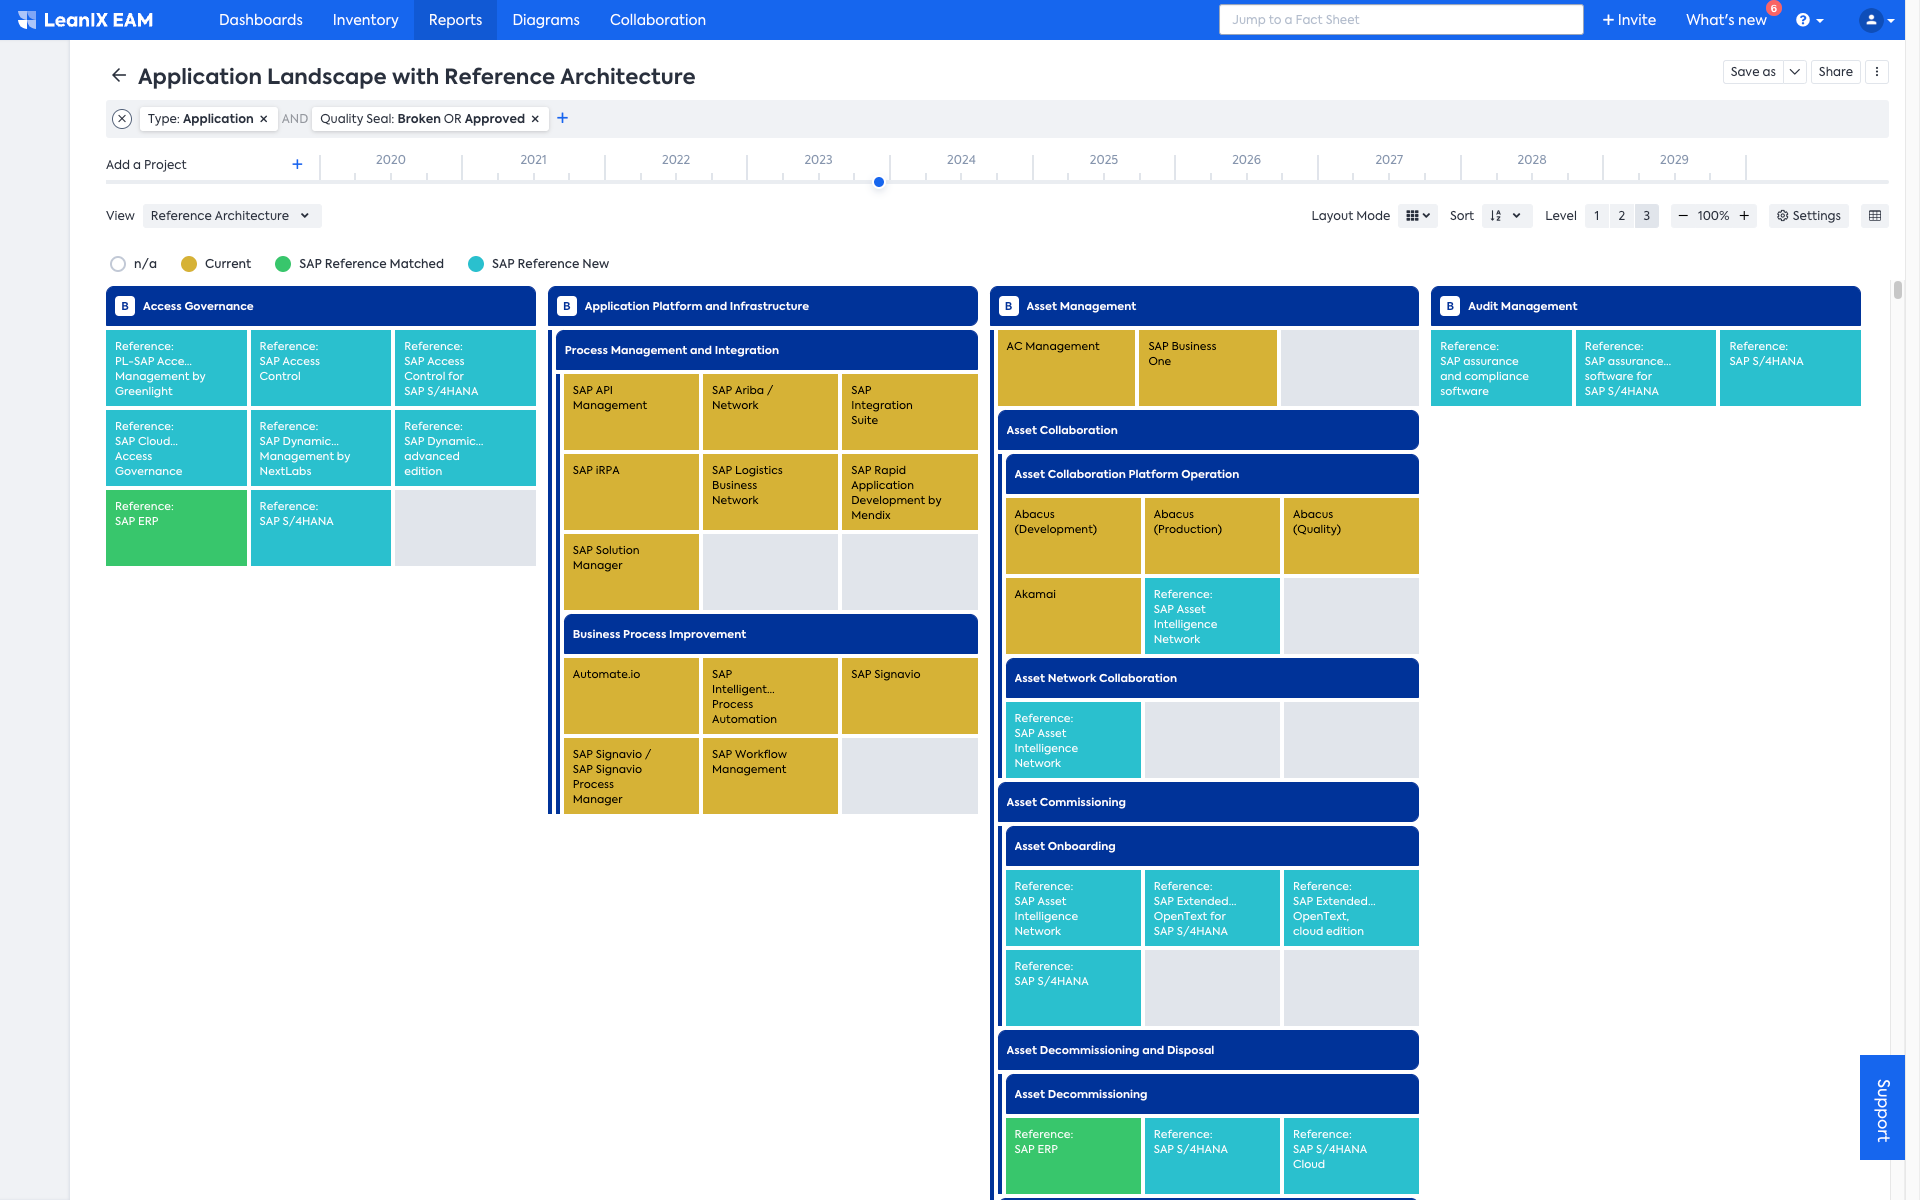
Application Landscape Report with Reference Architecture
Advanced: TIME or 6R Assessment to Identify and Track Key Changes through the Transformation
As part of the Discovery phase, we also recommend running either a TIME assessment and/or a 6R assessment as a good EA practice - depending on your transformation goals. This will help you get more out of the big transformation effort, and it will also provide you with KPIs you can use to track what will happen with your application landscape as part of the transformation. Moreover, it is one way of visualizing the current vs. future state of your application landscape.
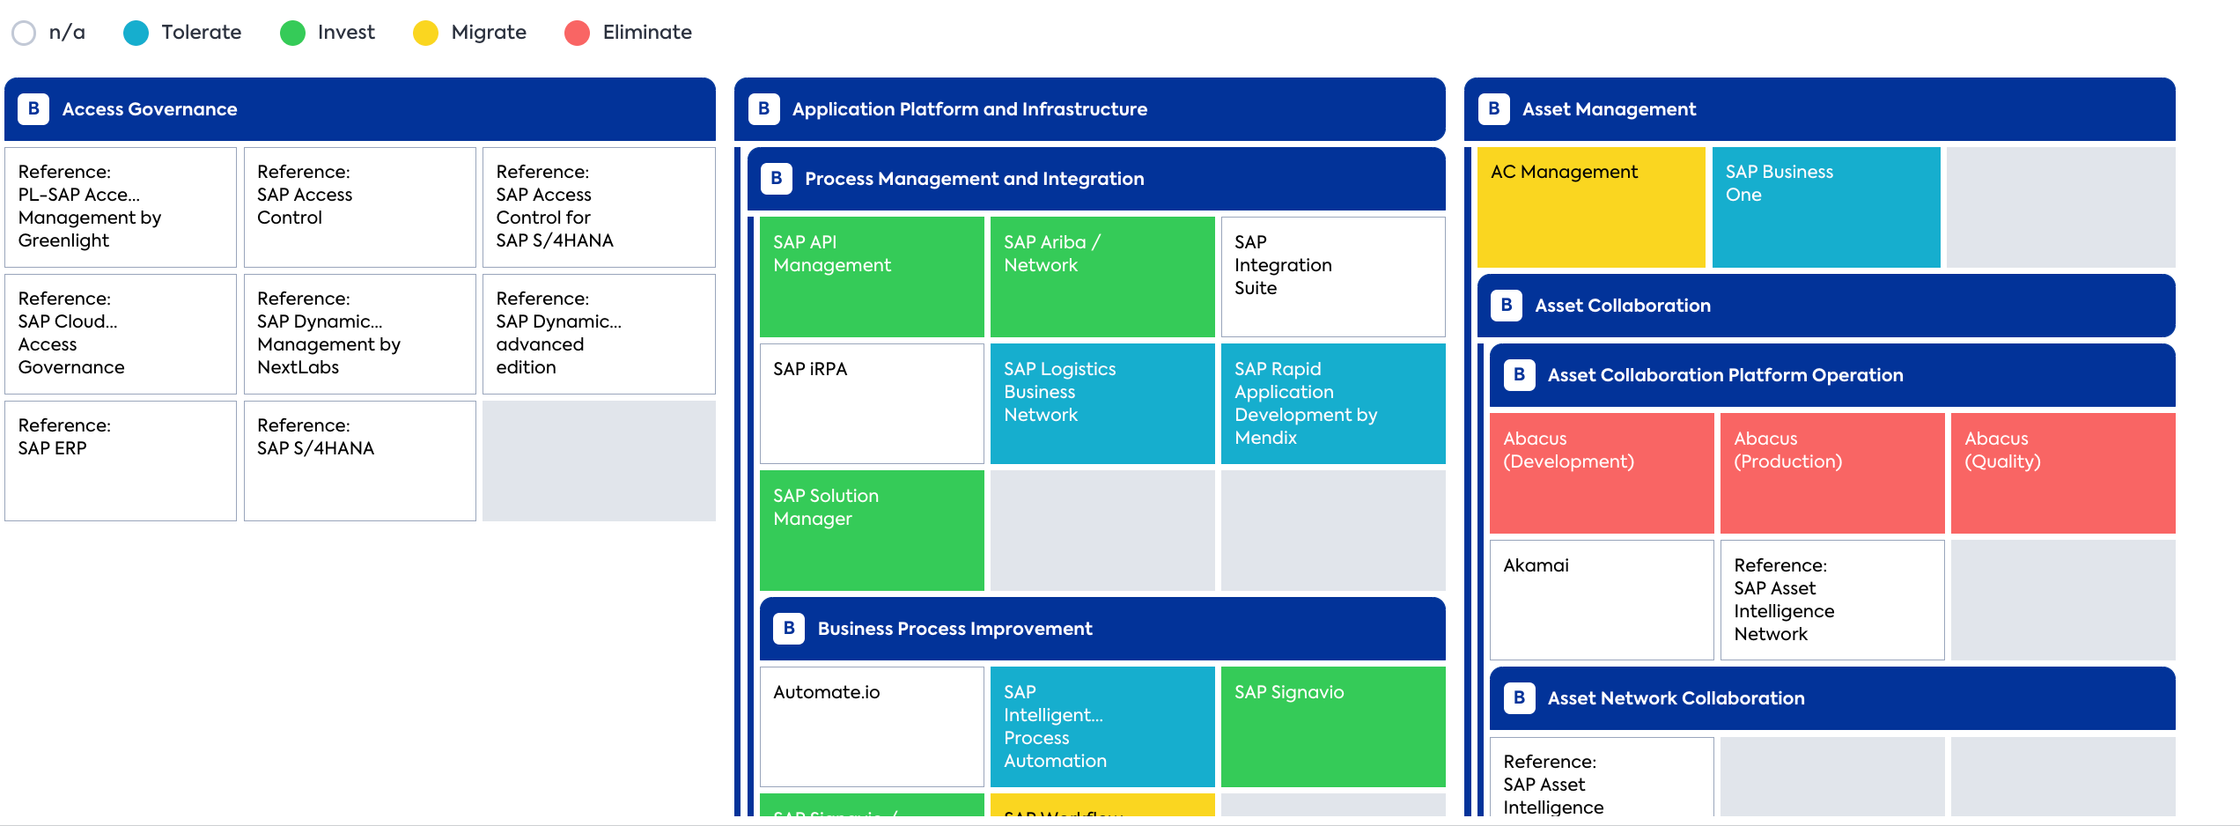
TIME Classification of Applications clustered by Business Capabilities
Step 3. Report and Communicate
In the world of an ERP transformation journey, effective reporting and communication play a pivotal role in driving successful transformations. Share these and other views with your stakeholders to give them full transparency of the as-is architecture and aspects to consider. You should also use the reports to identify any gaps in your data and enrich data if needed.
In this step, do the following:
- Build an EA-centric Dashboard with KPIs and reports that are relevant for you to track, e.g., completion of items in the LeanIX inventory and support the ERP transformation from EA perspective. There are some LeanIX best practices you can leverage, which are shared below. This dashboard will evolve throughout the different phases of the transformation. To know more, see Create a Custom Dashboard
- Define a format in which you want to share your results with different stakeholders.
EA-Centric Dashboard and Reporting
For each phase, LeanIX has prepared templates with KPIs and reports as an inspiration for the EA-centric reporting. In the Discover phase, we suggest including the following metrics suggested by LeanIX that can be set up with LeanIX KPIs and presented in a LeanIX Dashboard.
Phase 1 Dashboard for overview and communication
Out-of-the-box Template for the ERP Transformation
LeanIX is working on an out-of-the-box template for the ERP transformation use cases. Detailed documentation on how you can create a dashboard following this example, will be provided soon. In the meantime, reach out to LeanIX Support, if you want to implement this dashboard in your workspace.
-
Application Data Quality per Business Capability and Region (measured by % of Fact Sheet Completion): An Application Matrix Report providing a high-level overview of all Applications, clustered by Business Capabilities and User Groups involved in the transformation with a view of their completion. The color-coding shows the completion status of your Application Fact Sheet data.
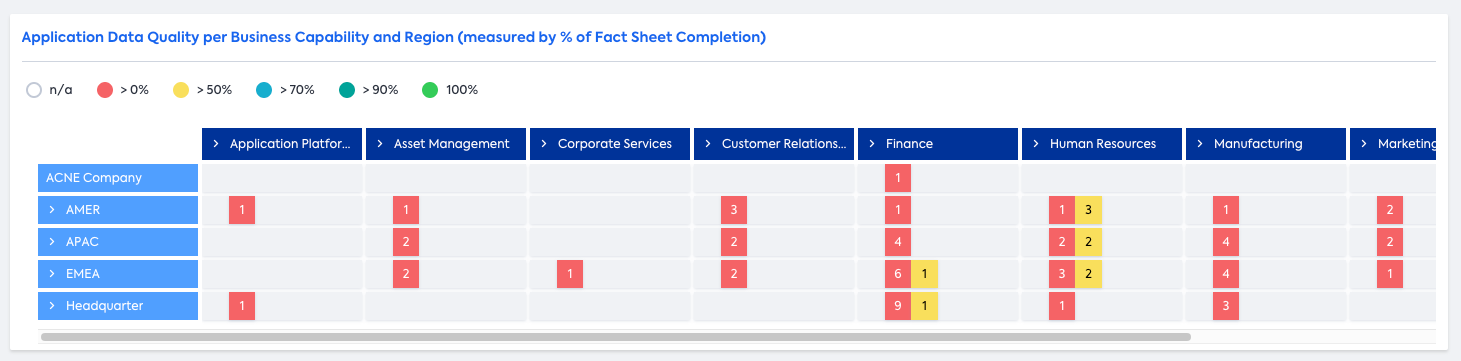
Matrix Report with Fact Sheet Completion view
-
Status quo of Scoping (measured by Business Capabilities reviewed): A pie chart showing the status of the Business Capability assessment by business owners, which is relevant for the scoping of your ERP transformation.
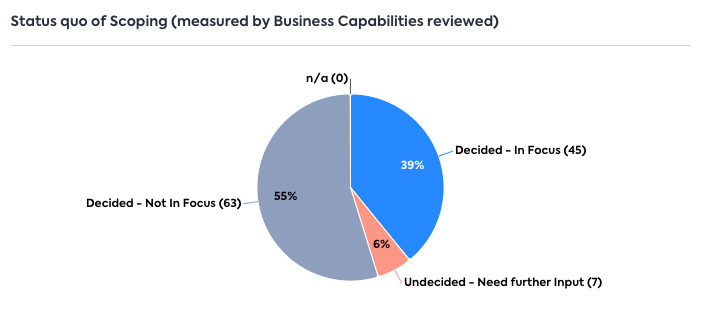
Status of scoping
-
Deep-dive Capability Assessment (number of approved Business Capabilities and break-down by assessment categories): Overview of KPIs to track how many Business Capabilities have been approved by assigned business owners and for how many Business Capabilities relevant dimensions (TIME, PACE Layer, Current Maturity, Target Maturity) have been assessed.
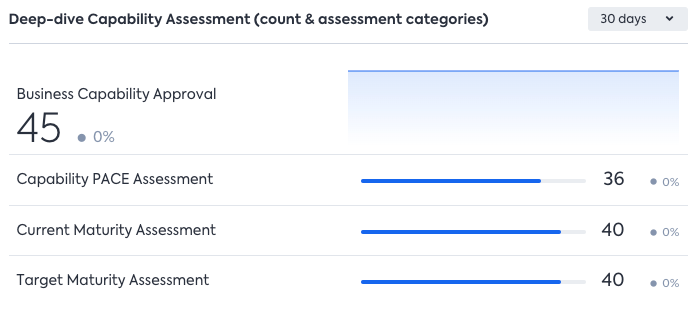
Status of Business Capability Approval
-
Applications, Organizations, and Interfaces in scope of the ERP Transformation: Overview of KPIs showing how large the scope of the ERP transformation is, based on the selected Business Capabilities. Helps answer questions such as “How many applications will we now need to move?”, “How many departments will be affected by this?”. These insights arm the EA with clear, tangible data points, with clickable links to inventory filters for further investigation.
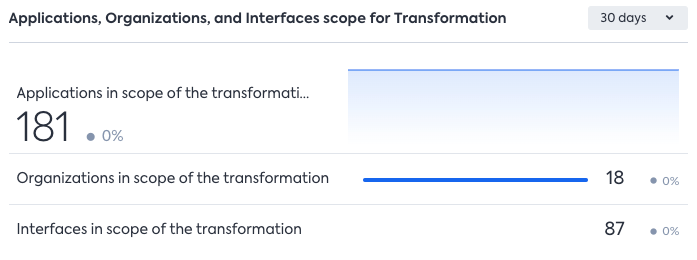
Overview of Applications, Organizations, and Interfaces in scope of the transformation
-
Deep-dive Application Data Quality: Overview of KPIs showing approval and data completion status of your Applications in scope. Approval as the final, top-level metric to confirm that all the underlying dimensions are filled & correct on the Fact Sheet (Quality Seal available, Fact Sheet overall completed, Functional Fit assessment completed).
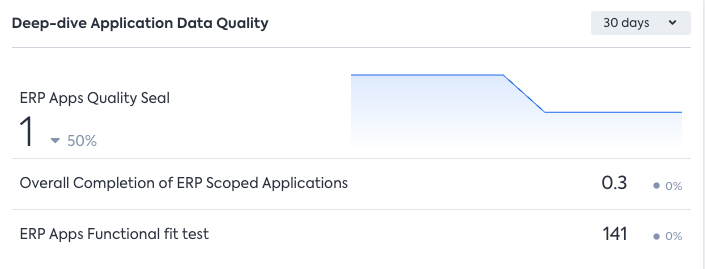
Overview of Application Data completion and quality
-
Deep-dive: Organization Data Quality: Organization Fact Sheets for Applications in scope with approved Quality Seal.
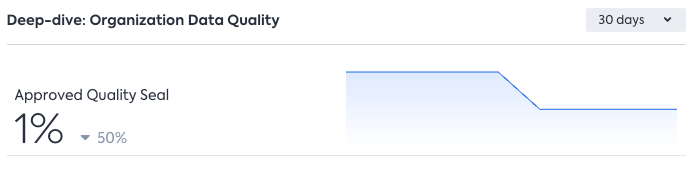
Overview of Organization Fact Sheet data quality
-
Deep-dive: Objective Data Quality: Objective Fact Sheets for Applications in scope with approved Quality Seal
-
Deep-dive: Interfaces Data Quality: Interface Fact Sheets for Applications in scope with approved Quality Seal
Share Insights with Different Stakeholders
Apart from creating an EA-specific view, you also need to decide which insights and metrics are relevant for other stakeholders who play a key role in the ERP transformation, such as Program and Transformation Managers, CIO, and other management stakeholders, as well as how to present those. You can leverage LeanIX Dashboards to create customized views. To learn more about creating custom Dashboards, see Create a Custom Dashboard.
Here are some best practices to consider:
- Align with the leadership and change organization early on on the KPIs and views they are interested in, based on what is possible with LeanIX.
- Define a format and cadence of how to present these KPIs; make sure to fit in the existing structure of the transformation program instead of creating parallel formats.
- Create different LeanIX Dashboards and saved Reports for different audiences, e.g.,:
- One high-level dashboard for all key stakeholders involved in the transformation program (adequate for C-Level and Program Manager)
- Dashboard for the EA core team
- Dashboard for Project Managers
- Keep in mind that your stakeholders might not use LeanIX on a daily basis. How can you engage the leadership and change the organization to go into the tool? Make sure that they understand the views that they will get, e.g., by having a well-structured dashboard with explanations on the landing page. Or sending them direct links to a specific (pre-filtered) Report.
- Engage your stakeholders in discussions, focusing on eye-opening insights that they need.
- Get approval and backing by ensuring that about 90% of your business stakeholders have seen and acknowledged your insights.
Updated 3 months ago