Application Portfolio Management Onboarding Dashboard: Enterprise Architect
The Application Portfolio Management Onboarding Dashboard for Enterprise Architects supports Enterprise Architects with their onboarding to Application Portfolio Management. It contains links to the Academy Courses, as well as the Onboarding Best Practice Metric Report.
Overview
This dashboard supports Enterprise Architects with the onboarding to LeanIX Application Portfolio Management. It provides an overview of essential learning and support resources that guide Users through the onboarding process. Beyond this, the dashboard includes a report with best practice metrics that allows Enterprise Architects to benchmark the quality of their workspace data.
The Onboarding Dashboard is available for all newly provisioned Meta Model v4 workspaces starting from 18th March 2024.
Dashboard Structure
The dashboard consists of the following areas:
- Welcome message and overview of academy courses
- Onboarding Best Practice Report
- Overview of further support resources
Key Features of the Dashboard
Academy Courses
The links point to dedicated academy courses that guide Enterprise Architects through the what, why, and how of the onboarding process to Application Portfolio Management.

Academy Courses for APM Onboarding
Onboarding Best Practice Metric Report
The Onboarding Best Practice Report helps Enterprise Architects focus on establishing data quality in their workspaces right from the beginning of their LeanIX journey. The metrics are aligned with the milestones laid out in the academy courses and provide orientation on what good data looks like for the different process steps.
Note
The metrics are drawn from best practices of several hundred customers. If it doesn’t fit to your situation, you are free to deviate from them to meet your needs.
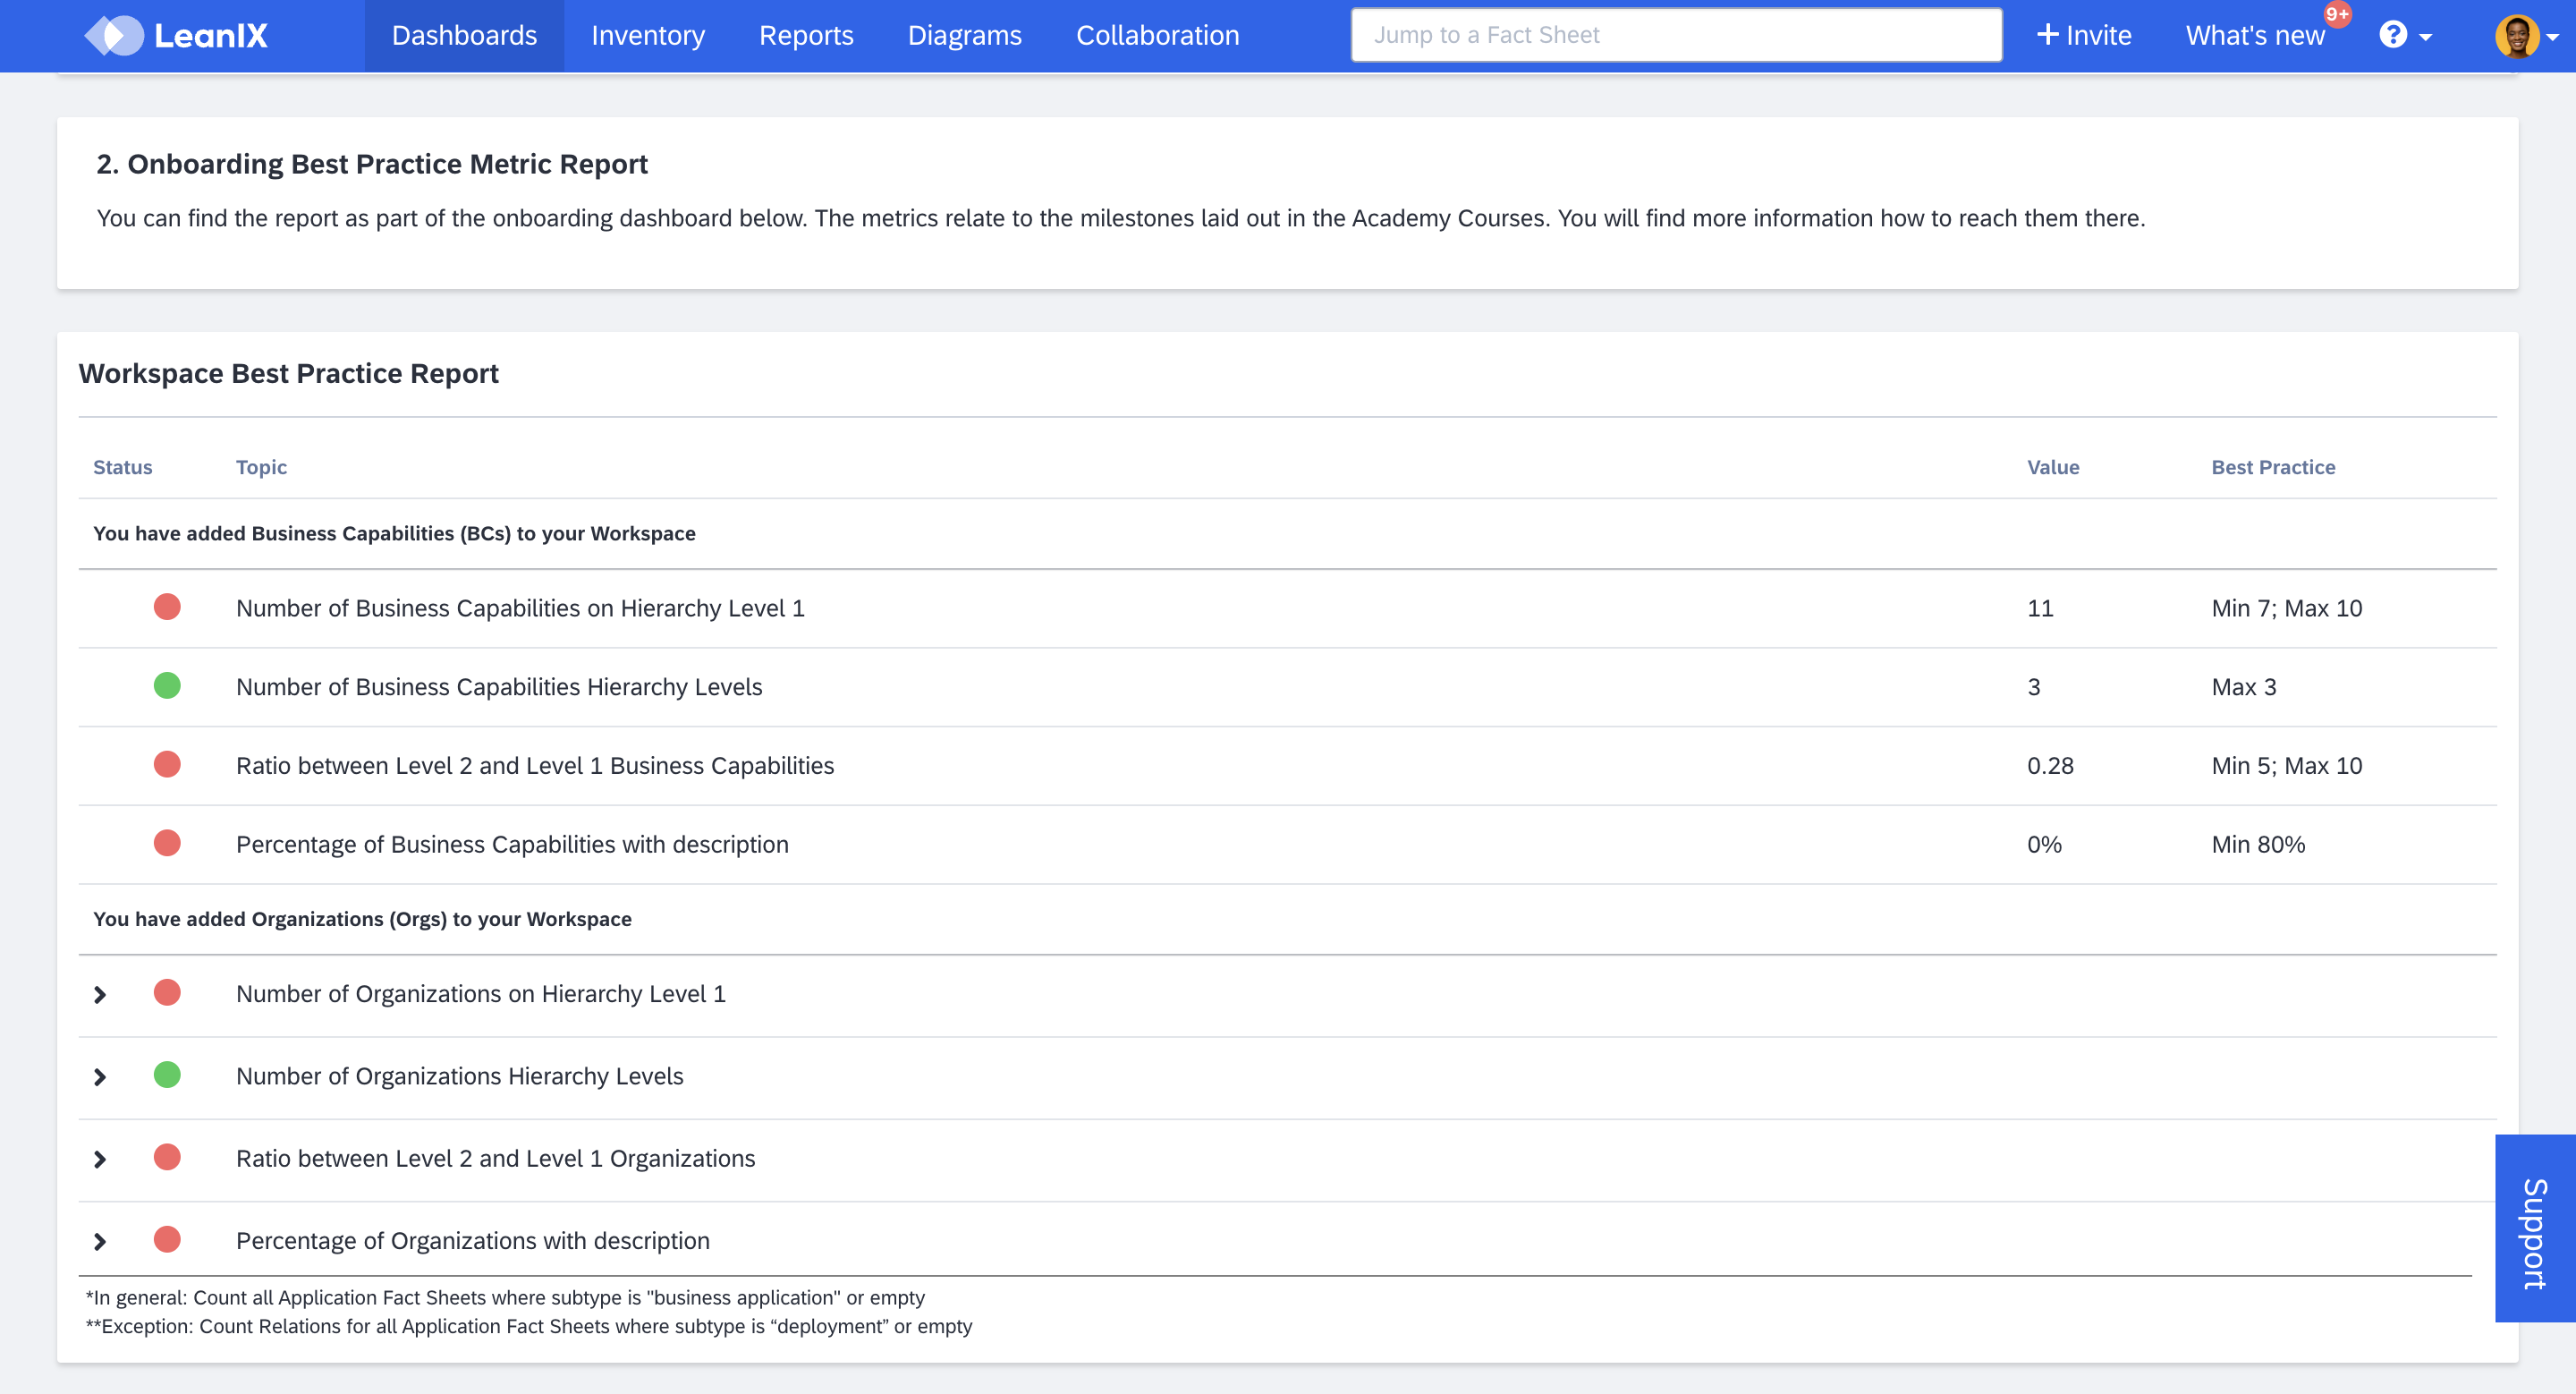
Workspace Best Practice Metric Report
Further Resources
This section provides links to various enablement resources that customers can use to find answers to their questions about LeanIX and Enterprise Architecture.
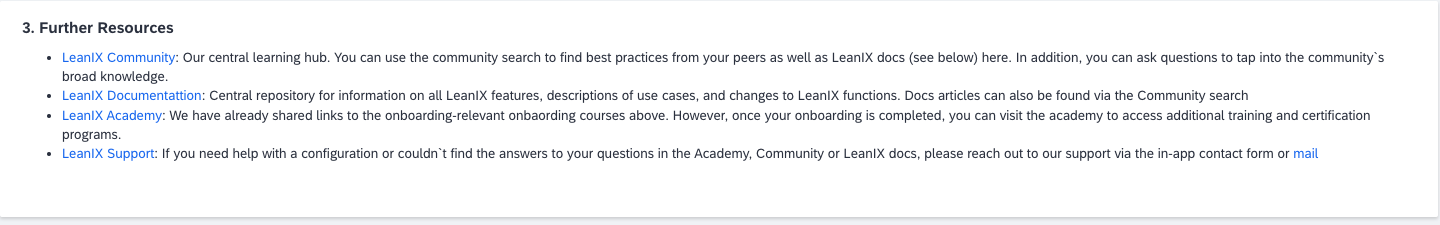
Further Resources Section
Understanding Best Practice Metrics
The reasoning behind various best practice metrics is explained below:
Business Capabilities
| Best Practice | Explanation |
|---|---|
| Level 1 Business Capabilities: Minimum 7, but a maximum of 10 added to workspace. Level 2 Business Capabilities: Minimum 5, but a maximum of 10 added for each level 1 Business Capabilities. | For most organizations, capturing 7-10 Business Capabilities in level 1 provides a strong foundation and offers a comprehensive overview. While a higher count at the outset leads to high effort. Also, it becomes difficult to follow the MECE principle (Mutually Exclusive, Completely Exhaustive) with large number. Avoiding excessive granularity is important to balance effort and productivity. This strategic approach supports initial use cases and provides further insights once a comprehensive Business Capability model is established. This methodology aligns with capability-based planning, Pace Layering, and strategy/goal alignment. |
| Not more than 3 levels of Business Capability hierarchy are added to the workspace. | Excessive depth in your categorization runs the risk of over-compartmentalization, potentially leading to a situation where the majority of users may find it challenging to understand the Business Capabilities. |
| At least 80% of Business Capabilities have a description. | It is important to ensure both your organization and stakeholders understand Business Capabilities with a clear, concise, and definitive enterprise wide definition. This clarity is essential for analyses and insights using LeanIX. |
Organization
| Best Practice | Explanation |
|---|---|
| Level 1 Organization: Minimum 5, but a maximum of 10 are added to the workspace (per subtype). Level 1 Organization: Minimum 5, but maximum 10 are added for each level 1 Organization (per subtype). | Starting with 5-10 Organizations in level 1 provides a strong foundation and offers a comprehensive overview, at the same time, it keeps maintenance effort low. You always have the option to add more Organizations at any time. |
| Not more than 4 levels of Organization hierarchy are added to workspace (per subtype). | Avoiding excessive granularity is important to balance effort and productivity. |
| At least 80% of Business Capabilities have a description. | It is crucial to ensure that both your organization and various stakeholders possess a comprehensive understanding of Organizations, supported by a clear, concise, and definitive enterprise definition. This clarity is essential for analyses and insights using LeanIX. |
Application
| Best Practice | Explanation |
|---|---|
| Applications* are added to the workspace, utilizing 60% of the quota. | Effective analysis depends on how well you have captured the data. A comprehensive Application inventory using at least 60% of your workspace quota is a good starting point. Before acquiring LeanIX, assess the appropriate size for your workspace quota to avoid an instance larger than your requirements. |
| More than 90% of Applications* have a description. | Descriptions of applications help stakeholders understand their purpose. Names alone may be familiar to certain groups (e.g., "Anaplan in Finance") but not to others. 💡 To easily add descriptions, you can use in-tool AI Assistance. Access it from the top right corner of the Inventory. |
| More than 90% of Applications* have a subscriber of type “Responsible”. | At the heart of LeanIX usage is reliable information about Applications. It is crucial that the information stays current, accurate, and comprehensive. Assigning responsibility and ownership of Fact Sheets through subscription ensures the reliability of information. |
| Relations At least 80% of Applications* are linked to Business Capabilities. At least 80% of Applications** are linked to Organizations. | Getting meaningful insights from LeanIX Reports relies on establishing accurate relations. |
| At least 80% of Applications* have a lifecycle other than N/A. | Important for obsolescence risk management and also ensures you can focus on Applications that are not already terminated. |
| At least 80% of Applications'* business criticality, functional fit and technical fit are assessed. | Key input factors for application portfolio assessment and TIME classification assessment. |
| Quality seal is approved for more than 80% of Applications*. | Ensures data quality validation through Fact Sheet owners. |
| At least 1 Application* is selected for elimination (TIME). | Signifies the initiation of application rationalization, marking the first business value generated in LeanIX. |
*In general: Count all Application Fact Sheets where the subtype is "business application" or empty.
**Exception: Count Relations for all Application Fact Sheets where the subtype is “deployment” or empty.
Useful Links
To learn about the onboarding dashboard for Fact Seet Owners, see Fact Sheet Owner Onboarding Dashboard.
To learn more about dashboards, see Dashboard.
To learn how to set a dashboard as default, see Changing Default Dashboard.
Updated about 1 month ago