Managing IT Risks Associated with Data Center and Server Locations
This is an example tutorial on managing the impact of data center and server location on risk mitigation and compliance using Technology Risk and Compliance.
Overview
The location of data centers and servers can also play a significant role in technology risk management. Varied data protection regulations across regions impact compliance and legal risks, influencing security measures and business continuity planning. Optimizing network architecture based on data center distribution enhances overall IT system reliability and reduces latency. Additionally, identifying fragmented data centers and hosting helps in cost savings during IT landscape consolidation. This tutorial helps you get started with mapping and analyzing the impact of location on technological risk mitigation.
Prerequisite: Build an Application Inventory in LeanIX
Begin by building application inventory in LeanIX, ensuring your workspace is equipped with essential data. Refer to the Application Portfolio Assessment use case for a detailed step-by-step guide.
In a nutshell, you take the following steps:
- Create your application inventory in LeanIX
- Create a business capability map.
- Enrich your data and establish relevant relationships among various fact sheets.
Step 1: Build an IT Component Repository
Build a comprehensive IT component repository in LeanIX. For guidelines and best practices on modeling IT components, see IT Components.
Use LeanIX ServiceNow Integration to bring your software asset data into LeanIX. To learn more, see ServiceNow Integration.
Use the SaaS catalog to automate the creation of IT components and provider fact sheets for SaaS services. To learn more, see the SaaS Catalog.
Step 2: Add the Software Versions and Assess Risk and Suitability
The next step is to add software versions and make a risk and suitability assessment based on it.
-
Add software version information by leveraging the lifecycle catalog. To learn more on how to use it, see Lifecycle Catalog.
-
As a best practice, group IT components into standardized categories using the tech category fact sheet. For guidelines and best practices on modeling the tech category, see Tech Category.
-
Classify the IT component for phasing out or termination following the Sunset model using tags such as Candidate, Leading, Exception, and Sunset. Editing in the inventory table view mode is a convenient way to do this. To learn how to edit things in table view mode, see Editing in Table View Mode. To learn more about using tags, see the documentation on tags.
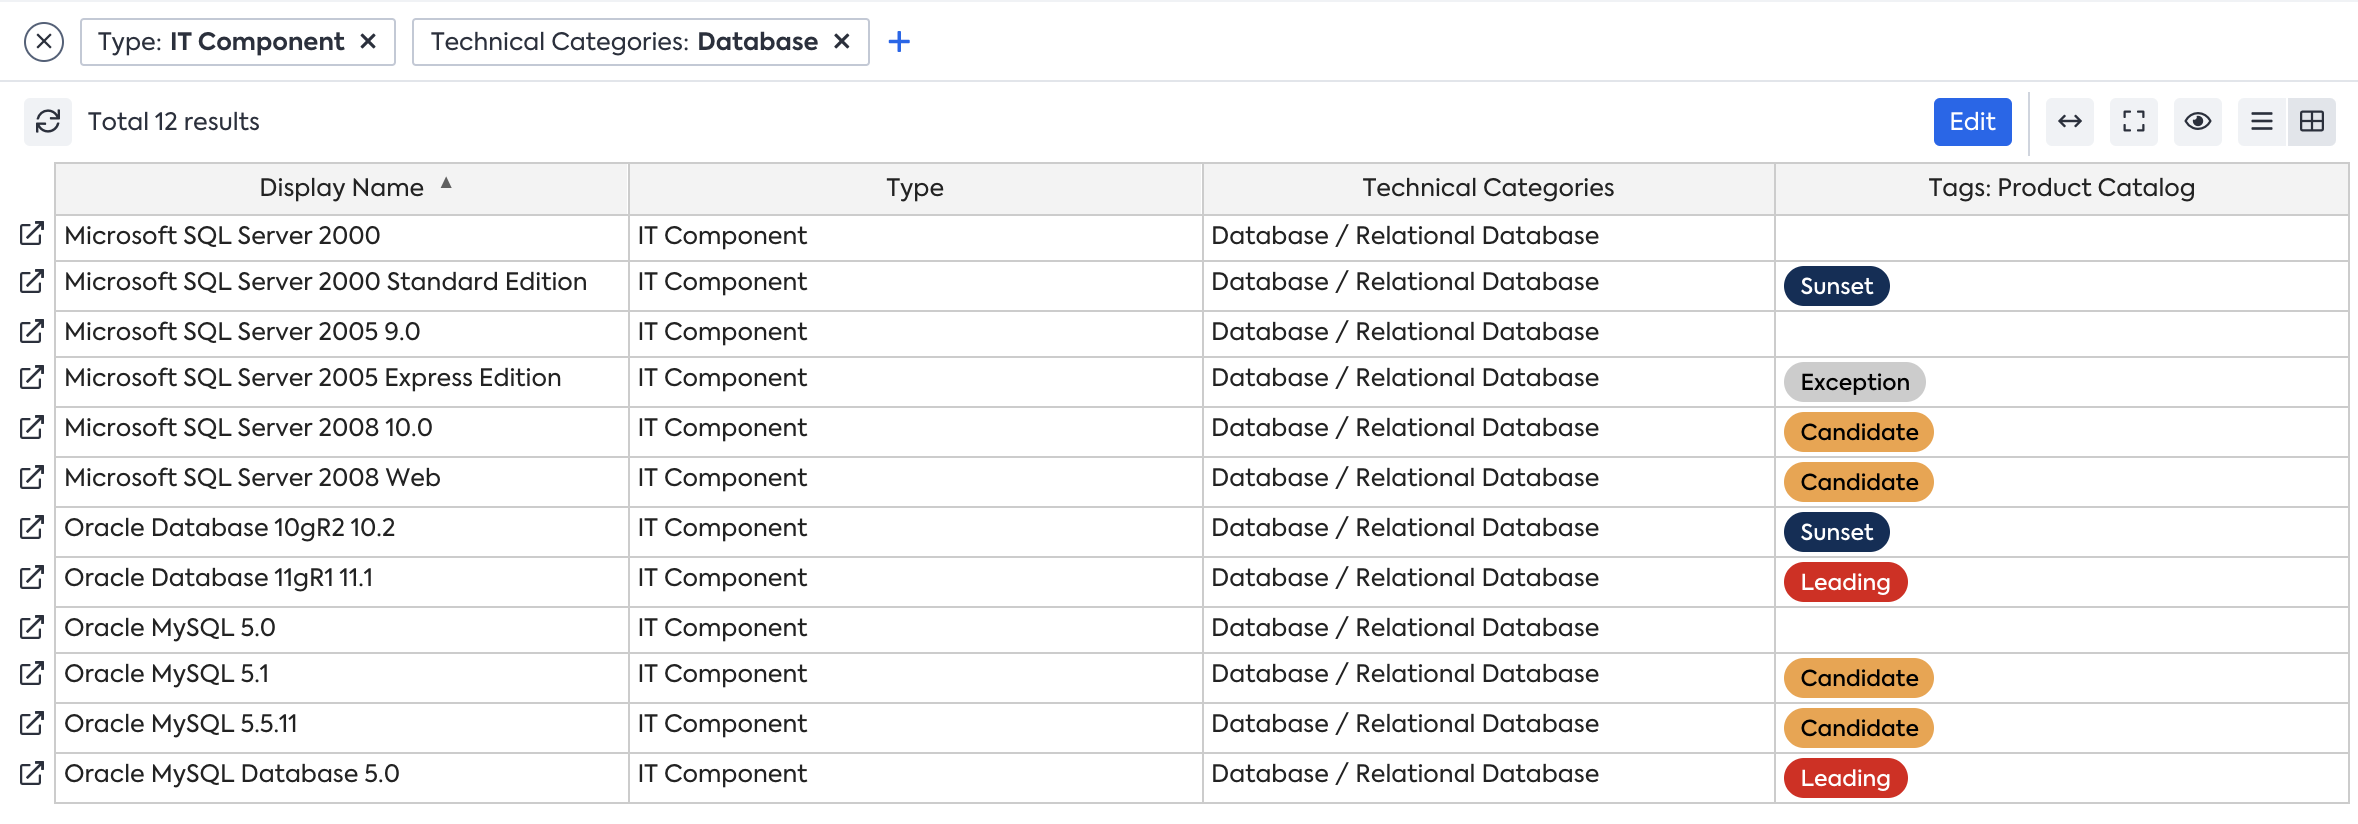
Classifying the IT Components
Step 3: Import Data Center and Server Location Information
Next, import the information on server and remote data center locations.
-
Use the Excel import/export feature to update the location details of your servers and data centers. To learn about Excel import/export, see Import Data via Excel.
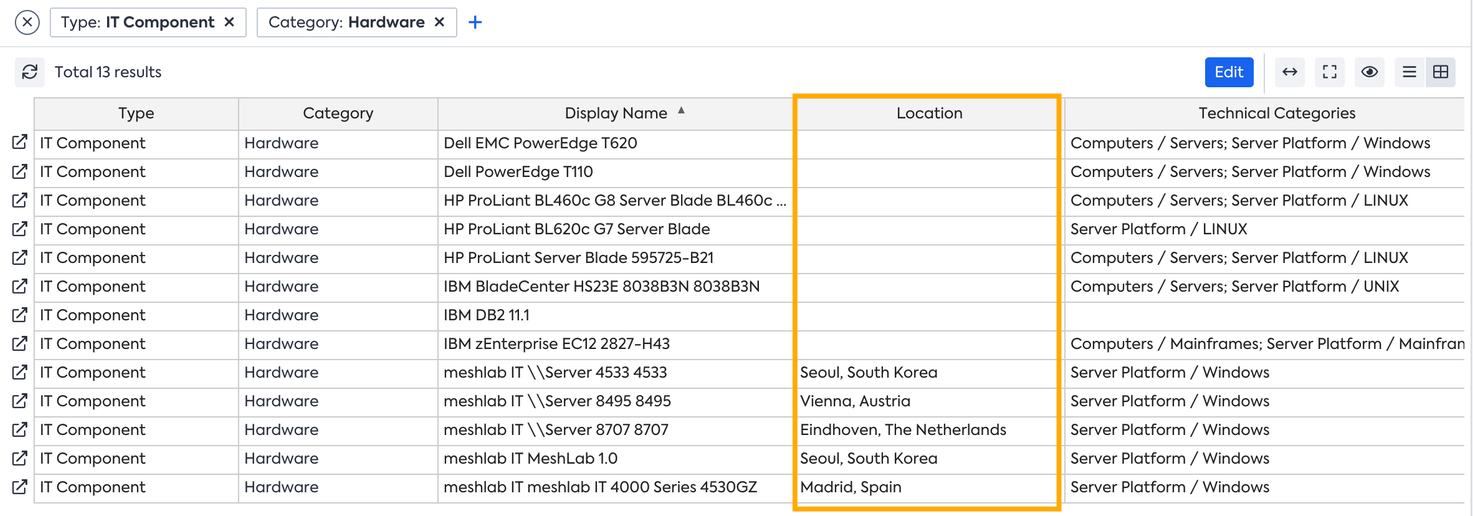
Importing Location details through Excel Import.
-
Make use of surveys if needed to collect the location information from relevant stakeholders. To learn about surveys, see Surveys.
Step 4: Link IT Components to Application Fact Sheets
Establish relations between IT components and applications to understand dependencies. Connecting data centers and servers to the applications they support provides insights into potential impacts, facilitating better management and decision-making within your IT infrastructure.
Establishing relations between IT Components and Applications
Step 5: Analyze and Mitigate Risks
To analyze data and plan initiatives for risk mitigation, use reports and diagrams.
Reports:
-
You can use the IT Component Landscape report to get a good overview of the imported IT components clustered by tech category. In the report view, apply tags to readily identify candidates for actions like phasing out, termination, or upgrade. To learn more about applying views, see Report View.
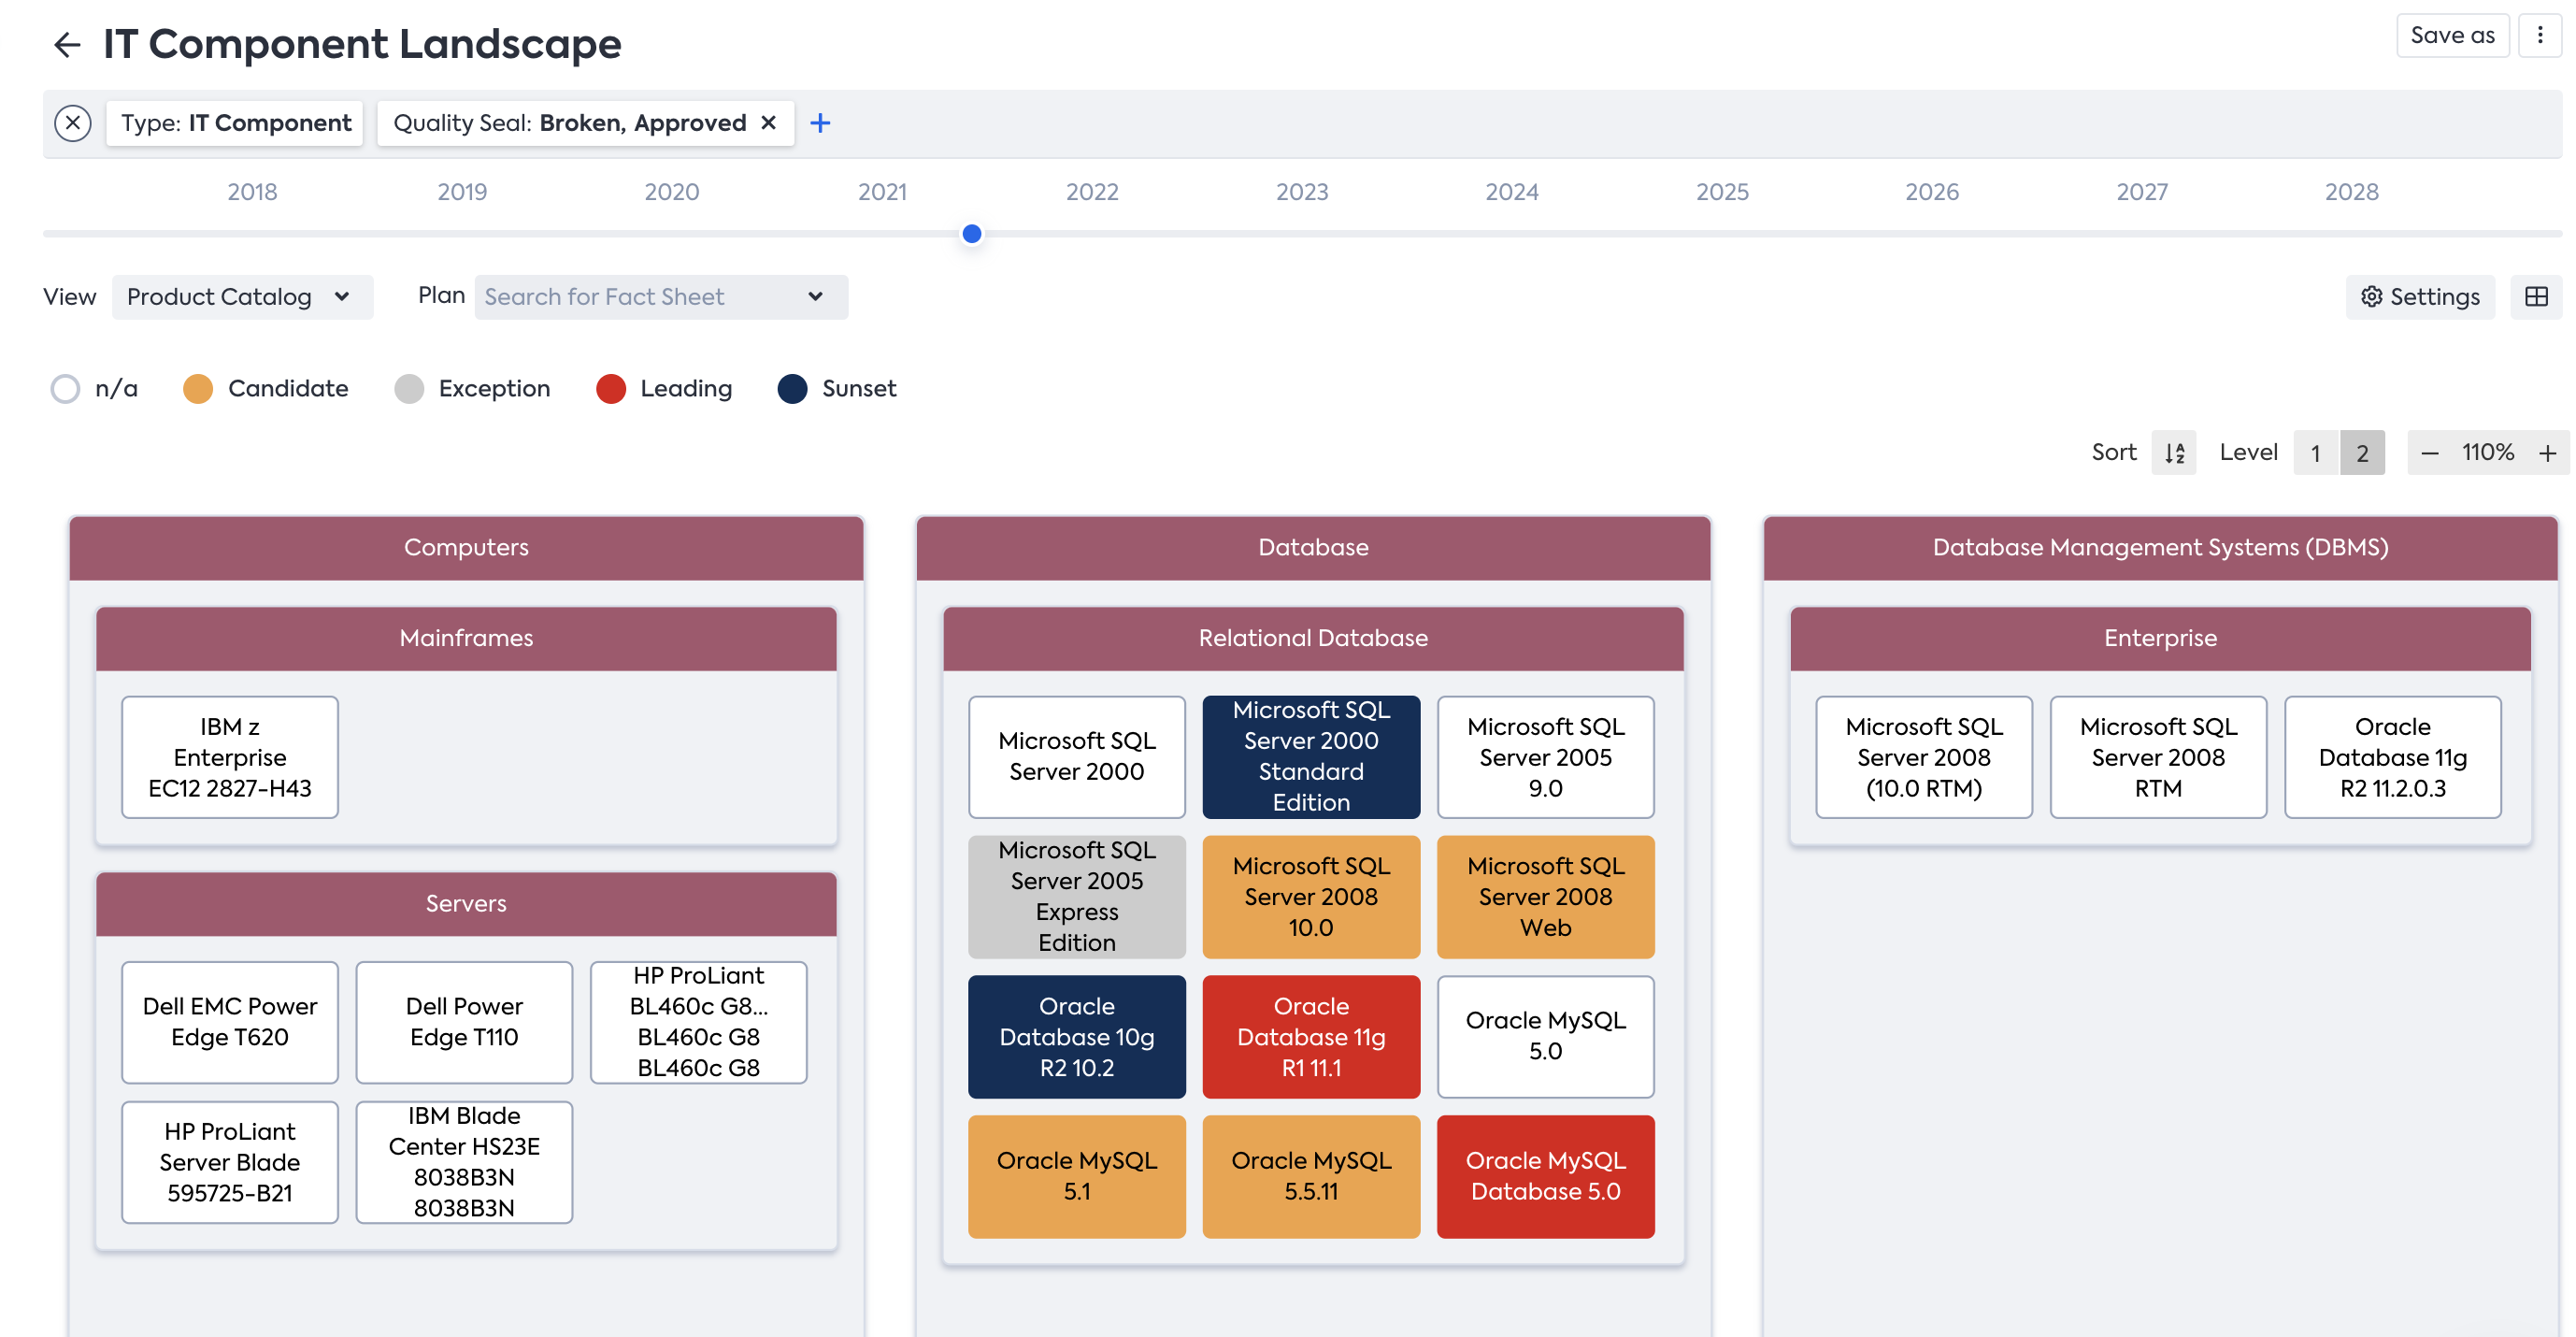
Overview of IT Component through Landscape Report
-
Use the IT Component Location report to get an overview of the geographical distribution of your servers.
-
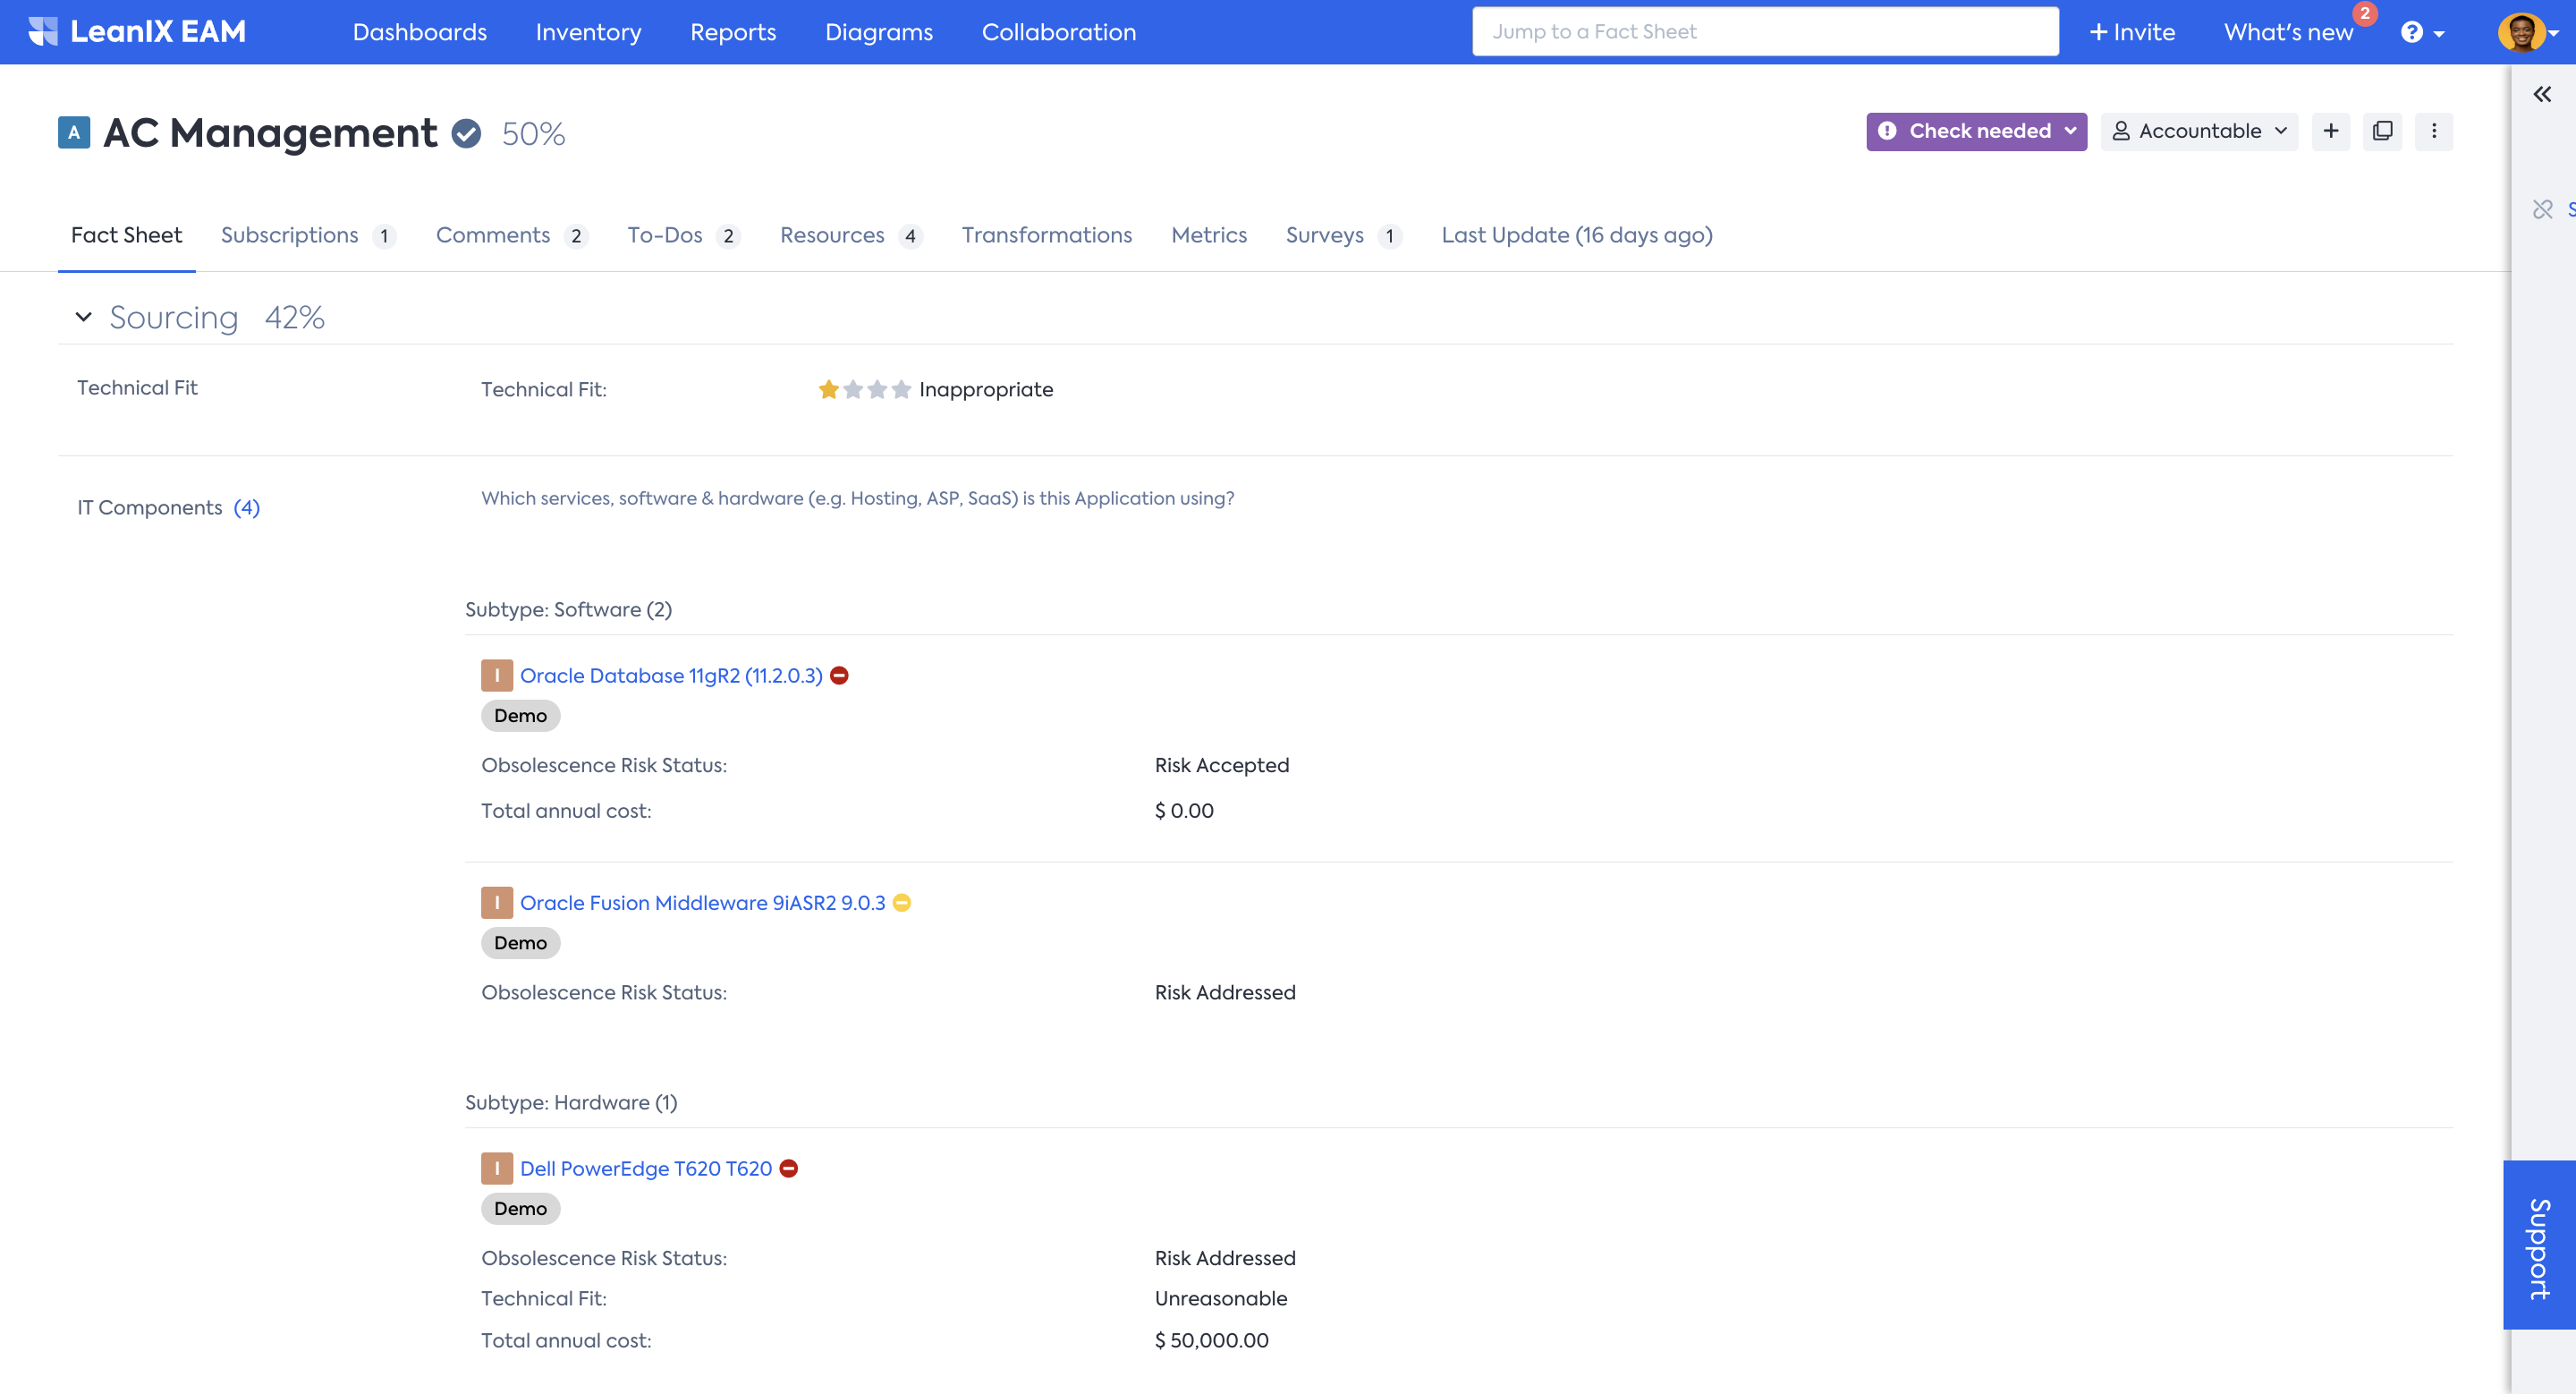
Use the Application Sourcing report to find out where applications using certain software versions are hosted.
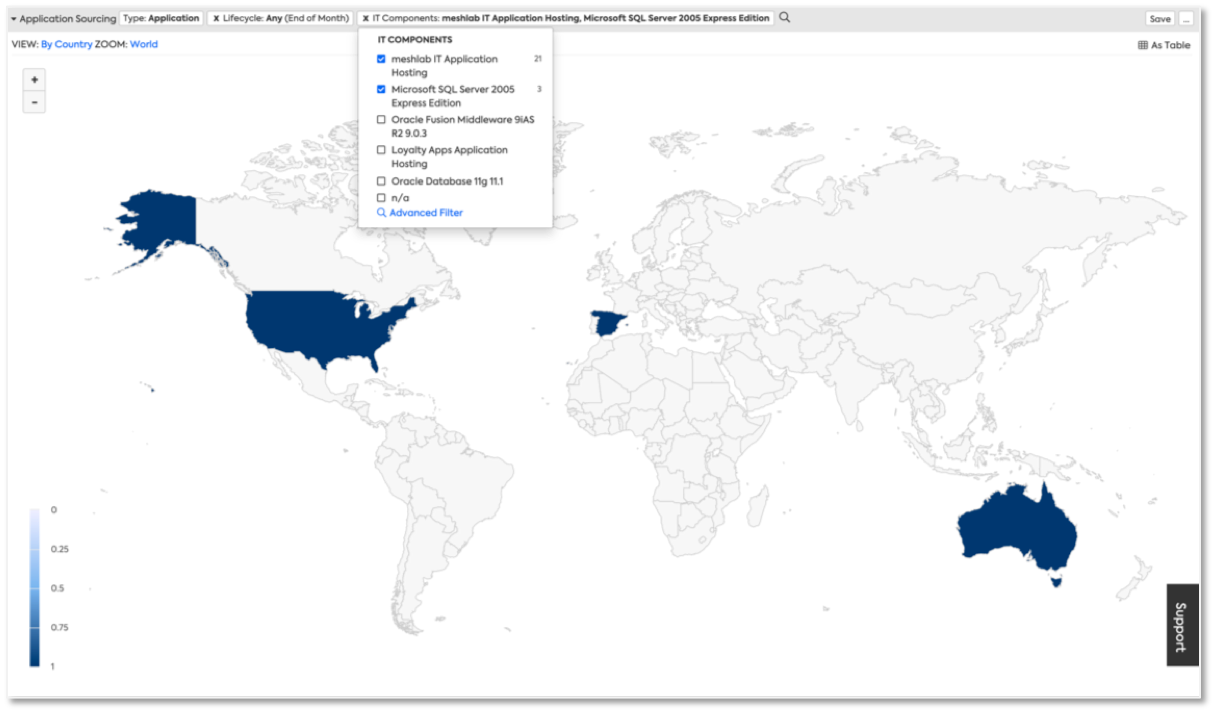
Application Sourcing Report
-
Use the Application Landscape report to understand how a particular data center location impacts your business.
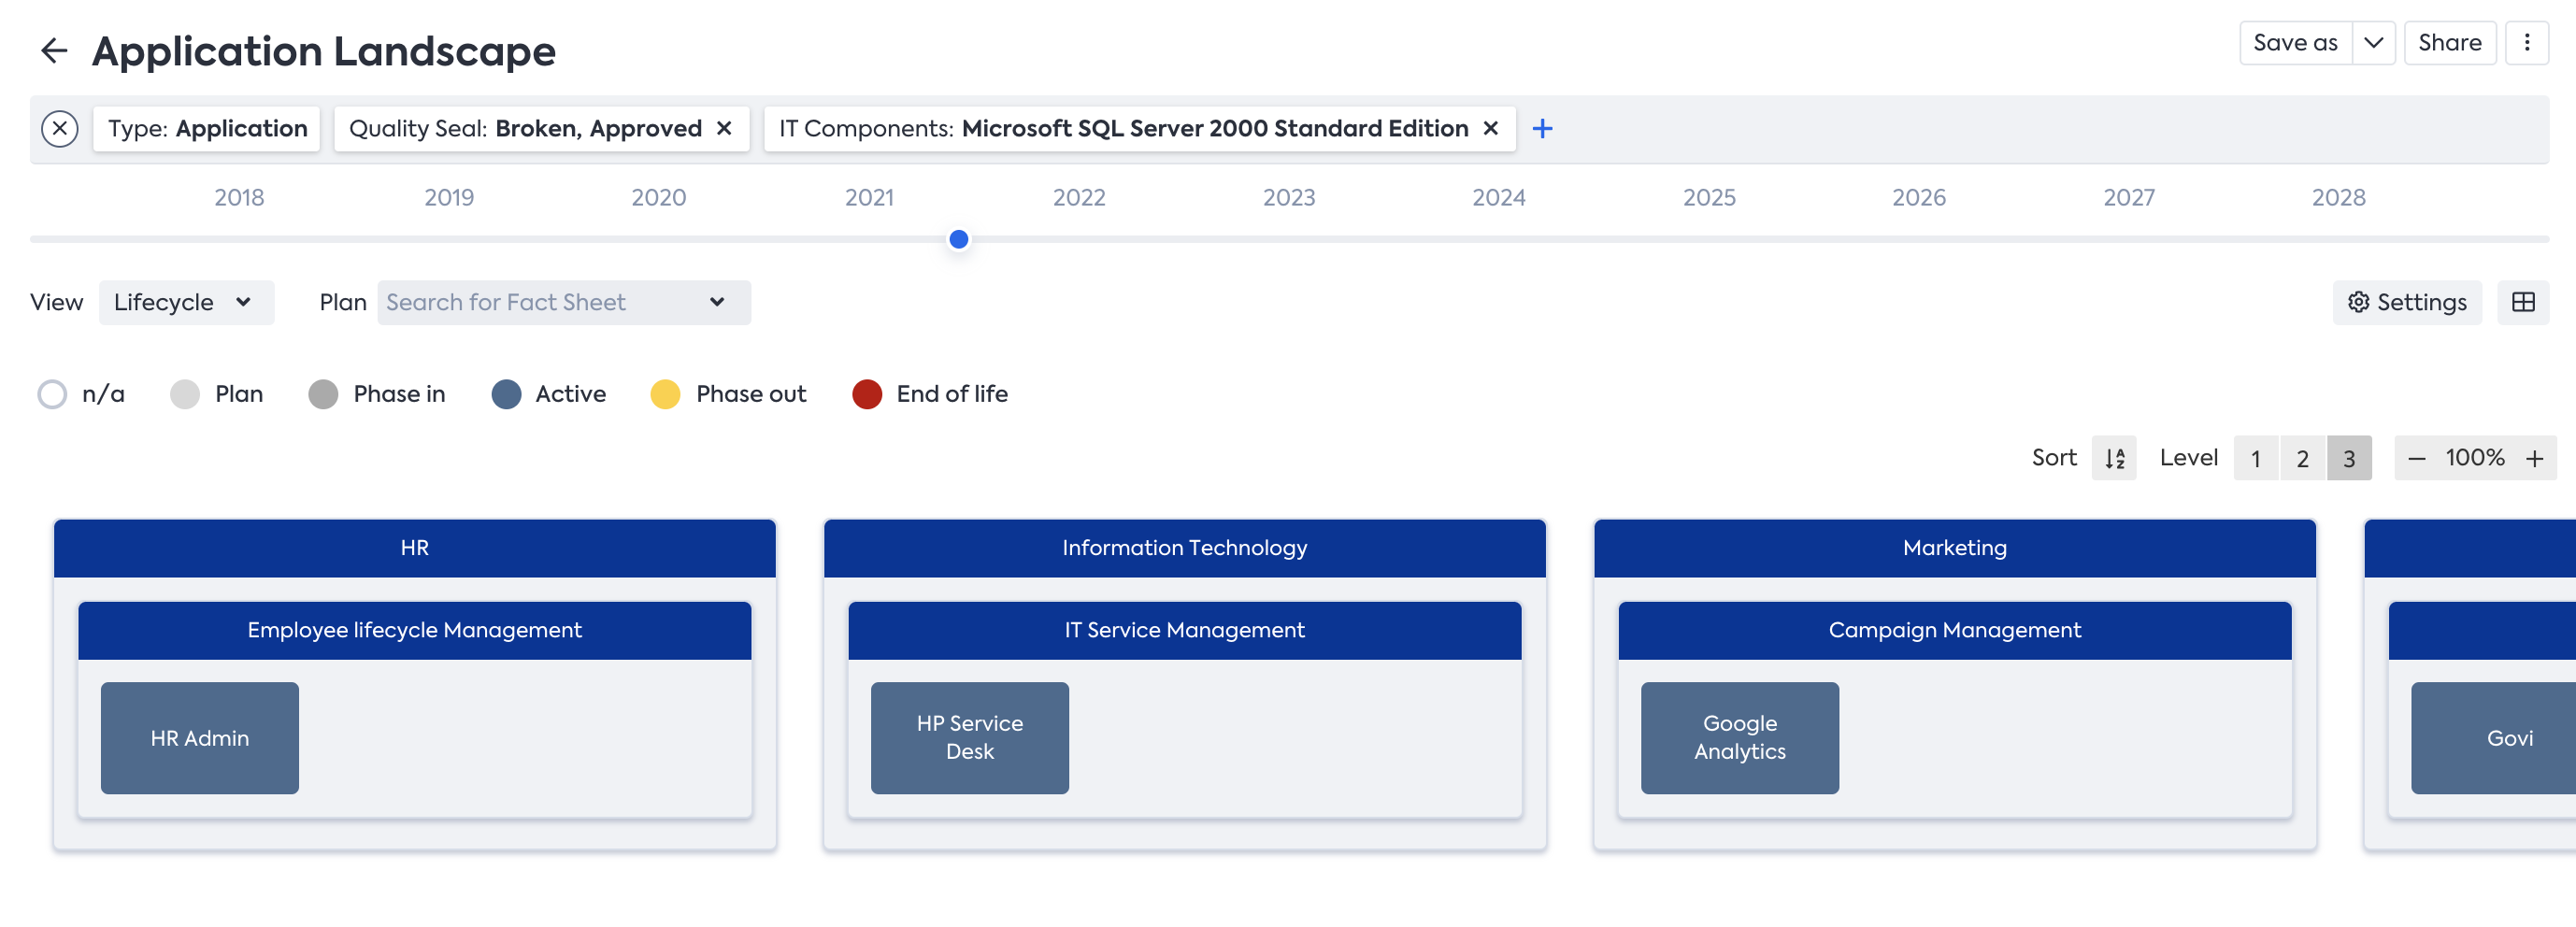
Application Landscape Report
-
Diagrams: Make use of diagrams to visualize and explore dependencies and relations between different architectural components. To learn more about diagrams, see Diagrams.
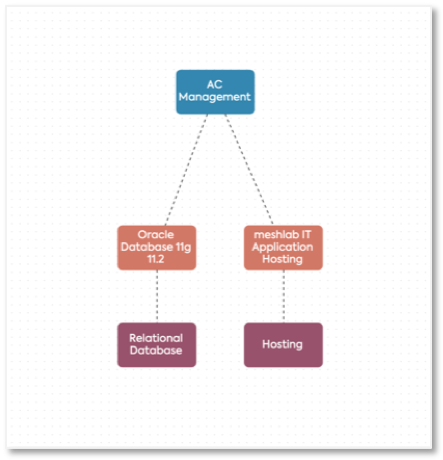
Visualize Dependencies and Relations With Diagrams
With the insight gained, you will be better equipped to make informed decisions in optimizing your IT landscape and improving compliance measures effectively.
Updated about 5 hours ago